Answers Hidden in Traffic Data Analytics: 4 Crucial Things to Learn
The adoption of traffic management software has been increasing as the availability of data sources, such as GPS, connected vehicles, and traffic sensors, has grown. Evaluated at USD 15.59 billion in 2022, the global traffic data analytics market may reach around USD 71.78 billion by 2032 at a CAGR of 16.50%.
The reason for this shift is simple: automated traffic data analytics solutions make unveiling answers hidden in road traffic data so much easier. Through this, they present traffic engineers and planners with the information necessary to enhance transportation networks' overall efficiency and safety one lane at a time. How?
Let’s investigate and find out how automated traffic management software can turn specific data types into solutions to burning traffic engineering challenges and streamline their manual resolution. But first, let’s look at the kinds of data these analytics platforms can use to attain this.
Type of data collected by advanced traffic data analytics
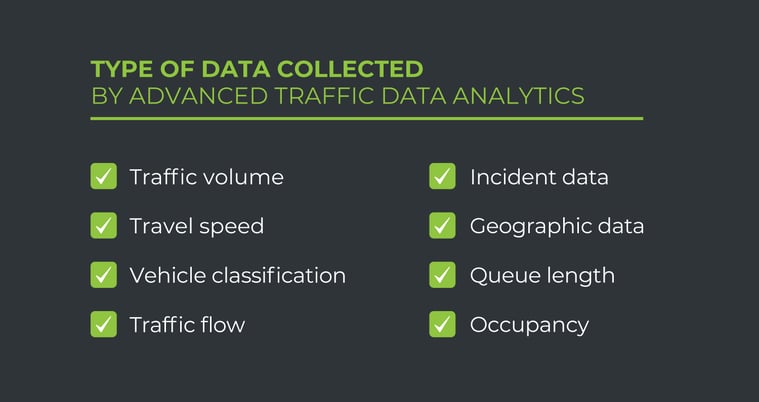
If traffic analytics software is the engine, data is the fuel that powers it. Traffic data analytics uses various traffic metrics to produce insights about patterns, driver behaviour, congestion, and more. Here are some common types of data used by traffic data analytics systems:

Many of these parameters are collected manually through live or video-based traffic counts, spot speed surveys, or roadside interviews. Although these traffic data collection methods have long been an industry standard, they can be time-consuming, resource-intensive, and prone to human error. For these reasons, they are typically used only for specific locations or shorter time durations — after all, you can’t have traffic surveyors stationed at all road sections, tracking traffic 24/7.
You can use cameras integrated with a real-time traffic data analytics system. This solution uploads the footage directly to the analytical engine, which continuously extracts and processes relevant traffic records. As a result, you receive live warnings on traffic events and violations and traffic performance reports. All that is without additional personnel and with a near-zero error rate.
Let’s see how automated traffic management software can help you act on specific metrics.
Insight 1: The impact of potential interventions
Automated analysis of traffic volume intensity enables traffic engineers to assess the impact of interventions such as adding new lanes, changing road configurations, or even larger-scale infrastructure investments.
To do that, traffic engineers can utilise various modelling and analysis techniques, such as microsimulation and macroscopic modelling, traffic flow analysis, scenario testing, or benefit-cost analysis. Automated traffic data analytics systems are the perfect aid in sourcing and processing traffic records for these analyses.
These models allow a traffic engineer to gauge the feasibility and impact of interventions on any level, both of a single lane and the entire road network. With that, organisations can select the interventions that best address the identified transportation challenges or objectives.
Together, all these functionalities provide a complete view of the context and characteristics of traffic conditions, allowing for better-informed interventions.
Country-wide traffic engineering savings
New Zealand Transport Agency (NZTA) worked with GoodVision to achieve just that. NZTA needed a reliable and expansive source of traffic intelligence that would help them inform mobility investments across New Zealand. On that scale, manual traffic data collection and analysis methods cost too much money and effort while requiring more time to deliver traffic insights.
With GoodVision’s video analytics platform, NZTA could collect and manipulate raw traffic data much more efficiently. Several stages of the data cycle were automated, such as classification or reporting metrics. Video data captured with cameras was processed and uploaded to the cloud, which helped cut data management costs by over 50%.
Overall, the traffic data analytics platform provided insights for several investments in the New Zealand transportation system, and NZTA continues to use GoodVision’s solution while working on upcoming interventions.

Insight 2: The demand for non-motorised modes of transportation
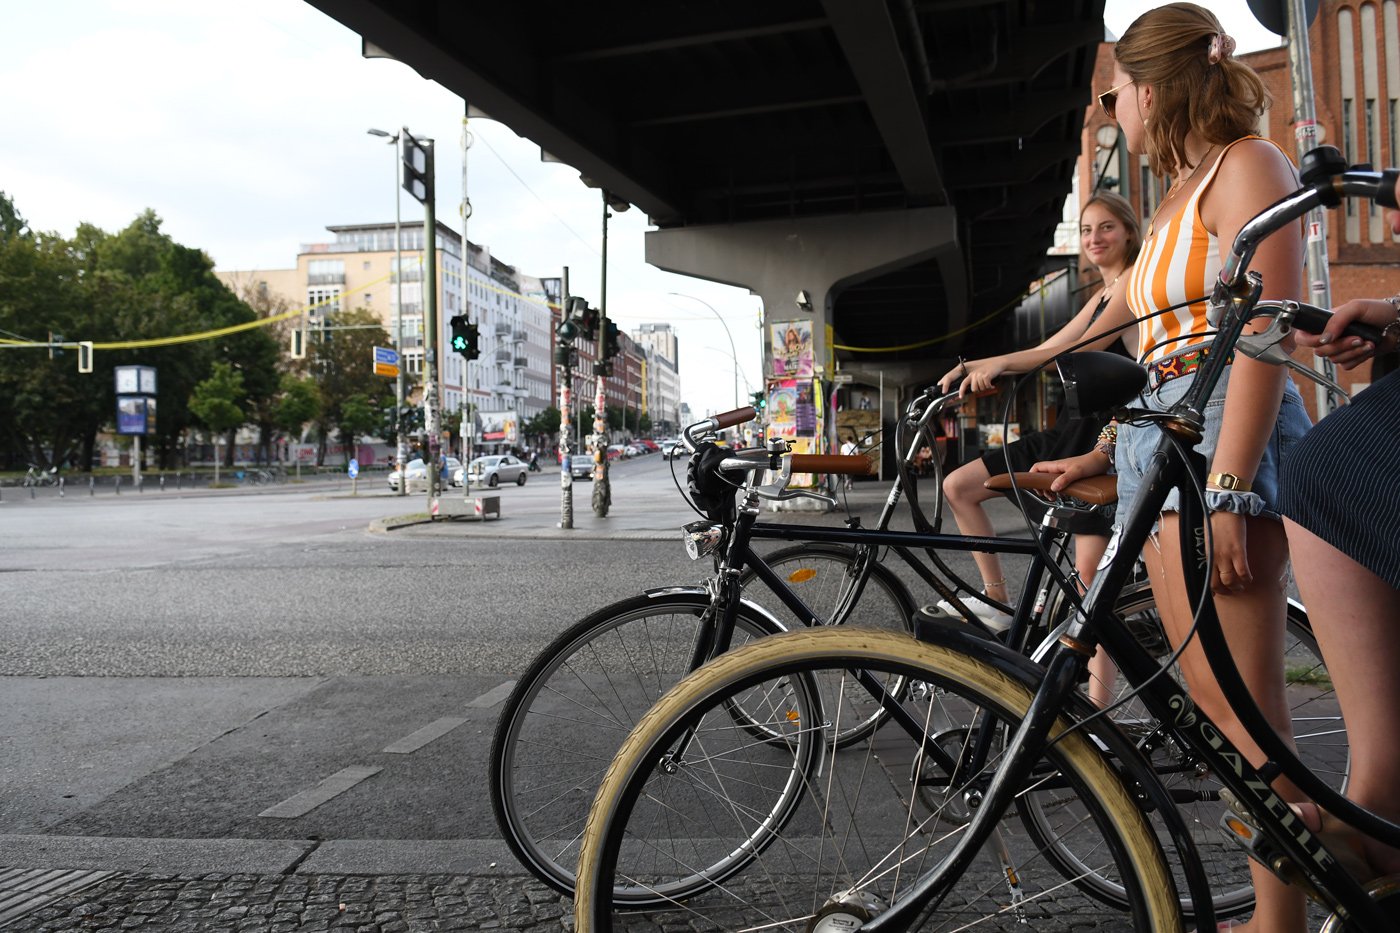
How we address climate challenges and rapid urbanisation will largely depend on how we move around our cities. Studies show that switching to non-motorised transport (NMT) can be an answer. For instance, cyclists generate 84% less CO2 daily than non-cyclists. But first, we need to understand how to make this transition.
Here, mode share and demand analyses can be used. These help traffic engineers and urban planners understand how NMTs are used and evaluate the demand for micromobility infrastructure in the current and planned road network. For example, modellers can identify areas with high pedestrian or bicycle activity and plan the development of appropriate facilities, such as sidewalks, pedestrian crossings, bike lanes, or bike-sharing programs, to accommodate the demand.
Smoothing out pedestrian and bicycle paths
In some scenarios and scenes, the main concern is understanding the patterns of pedestrian movement and micromobility. The Danish municipality of Vejle contacted one of our partners, ATKI, with a request to develop an effective solution for traffic data collection and measurement in the city’s centre. The Rådhustorvet plaza and neighbouring streets are venues for many events, so assessing the area's pedestrian and bicycle movement is key for organisers and the city.
With counting cameras plugged into GoodVision Live Traffic, ATKI could capture real-time traffic data on all modes of traffic in the selected locations. Then, this data was automatically uploaded to the GoodVision Video Insights platform, allowing for live classification of traffic participants and thorough situation analysis. This included retroactive analysis with the use of historical data.
But there’s another crucial factor that must be considered when making the transition to NMT: safety.
Insight 3: Ways to protect vulnerable road users
“Over half of fatalities occur on just 20% of roadways. I’ve seen that over and over in communities. I definitely encourage communities to look at their data and map it out to be able to get to that granular information.”
This quote from Jane Terry, Vice President, Government Affairs at the National Safety Council, makes it very clear that the answer to road incidents lies in traffic data analytics.
Parameters like vehicle trajectory allow traffic engineers to investigate road incidents and optimise infrastructure design to protect vulnerable road users such as pedestrians and cyclists. However, manually checking object trajectories on roads involves visual observations and data collection through on-site monitoring.
In this process, personnel is stationed at specific locations along the road, carefully tracking the path and movement of passing vehicles. They note down (often on paper) key trajectory-related details such as starting and ending points, intervals, time, lane changes, turning, etc. Multiple observations are made at different times or on different days to capture variations in object trajectories due to varying traffic conditions or weather to ensure accuracy and reliability. Only then can the data be compiled for analysis.
Eliminating high-risk crossings
Automated traffic data analytics models can significantly expedite traffic data collection and processing. These tools use object detection and machine learning to identify collision points, speeding violations and other accidents in datasets captured by cameras. Thanks to that, they can quickly extract incident records from sources such as video footage. Once the datasets are ready, traffic management software processes them to find incident patterns and dangerous areas with high rates of near misses and collisions.
Last, humans are only involved during the analysis stage, where their skills are best used. This gives them more time to focus on turning insights from the data processing model into incident prevention measures such as dedicated bike lanes, pedestrian-friendly crossings, traffic calming measures, improved visibility at critical locations, or even targeted educational campaigns. All that helps develop a more inclusive and sustainable transportation system that prioritises the safety and well-being of all road users.

Insight 4: Optimising intersections
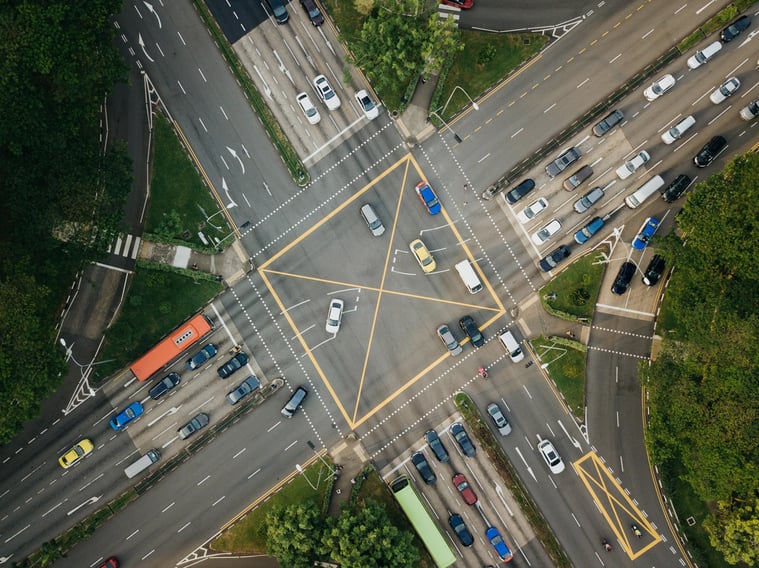
Intersections are a fundamental part of any road network, but at the same time, they are among the most problematic ones. According to the Federal Highway Administration, about a quarter of traffic fatalities and roughly half of all traffic injuries in the United States annually are attributed to intersections. Intersection delays also contribute to traffic inefficiencies, making up 12-55% of daily commute travel.
While safety can be improved using trajectory data, traffic engineers can use queue and occupancy data to address intersection inefficiency.
Normally, the process of gathering data for this purpose resembles that for trajectory records. Personnel are stationed close to intersections or bottleneck areas, observing queues and occupancy levels. They note down metrics such as the number of vehicles, the time spent in the queue, and the length. Later, this data is compiled for analysis.
The information derived from automated analysis helps understand the impact of signal timing adjustments and coordination. With this information, traffic engineers can verify the feasibility of adaptive traffic management strategies and other interventions.
Cost-efficient traffic volume analysis
However, collecting (and later processing) real-time traffic data using these already inefficient methods gets increasingly difficult as the number of analysed intersections increases. Attiko Metro SA, one of our clients, needed to measure the traffic volume and quality at 130 crucial intersections in Thessaloniki, Greece. The agency knew that with this many scenes, processing video footage would be inefficient in terms of time and cost.
To streamline the process, Attiko decided to use GoodVision Video Insights. The solution is priced based on the duration of the delivered footage rather than traffic intensity. Thanks to that, the analysis cost is relatively low compared to manual methods.
In addition to savings, the platform enabled Attiko to work on multiple traffic scenes simultaneously and perform analyses multiple times for different scenarios. As a result, the agency could save money and time and get more reliable results.
Turn insights into impacts
Improved road safety, data-driven decision-making, optimised traffic, and making a smooth switch to NMT—these are just some of the benefits traffic engineers, urban planners, and municipalities can get from utilising traffic data analytics. Get in touch if you want to hear what ideas we have to help you act on your traffic data.


