
Published by Daniel Stofan on
Driving behaviour factors that refer to speed, critical gap or follow-up headway, are the most complex data to obtain in an empirical way. In this article, principal engineer of Vectio Traffic & Transport Planning, describes how to obtain these parameters with GoodVision Video Insights platform.

“Driving behaviour factors that refer to speed, critical gap, or follow-up headway, are the most complex data to obtain in an empirical way. GoodVision provides traffic modellers with an interactive platform to obtain the above-mentioned behavioural parameters through a video processing approach. In this way, parameters obtained can be used to calibrate and validate the microsimulation program, such as VISSIM.”, says Yang Wang, Principal Engineer at Vectio Traffic & Transport Planning.
Recently, Yang Wang wrote a traffic study article about traffic performance analysis. Summarising it won’t do it justice, so I’m sharing the entire Yang’s study with you. You can find the original article here, and the version in Spanish at Vectio’s Blog.
About Vectio
Vectio Traffic & Transport Planning is an independent transport planning consultancy company with offices in Madrid and Asturias, Spain, and London and Birmingham, UK. Vectio focuses its business on transport assessments, travel plans, traffic engineering studies, and access design.
Over the last 13 years, Vectio has always maintained a desire for innovation, committed to the technology that is most requested by our customers. Vectio cooperates with GoodVision and utilises Video Insights platform for the traffic data collection and analytics on their projects.
“What sets Vectio apart from its competitors is the use of the best technology for collecting and analysing traffic and mobility.”
About GoodVision
GoodVision Ltd is a company from London, United Kingdom, established in 2017. GoodVision provides transport planners with everything they need for transport data analytics in one place. With GoodVision’s products, transport surveyors and planners achieve incredible productivity on their transport planning and modelling projects.
GoodVision provides a complex traffic analytics platform called GoodVision Video Insights. The platform combines unbeatable traffic data extraction capability from videos and cameras, with unique traffic data analytics for traffic modelling, simulation, and behavioural analysis. With this solution, transport analysts get data from traffic surveys in the most convenient way ever, and traffic modellers save 95% of their time by automating the traffic model calibration.
Visit GoodVision’s website and the LinkedIn profile if you want to know more about what GoodVision does. If you want to try our traffic analytics platform for free, visit my.goodvisionlive.com.
Introduction to the analysis
Traffic evaluation analysis is studied on the performance of traffic infrastructures, such as highways, signal or non-signal-controlled intersections, etc. This type of analysis focuses on the interactions among various traffic participators (both motorized and non-motorized) and infrastructures, in order to reveal the relationship between traffic participants and the resulting traffic performance.
As a result, traffic evaluation analyses are empirical studies that heavily rely on high-quality measurements of real data, including the following aspects:
- WHERE: The geometric aspect (direction, lane, etc.).
- HOW MUCH: The density and intensity of the traffic.
- WHO: Infrastructure users, type of vehicle, pedestrians, etc.
- WHEN: Periods, such as rush hour and off-peak hour, or public holidays and business days.
- HOW: Driving behaviour parameters (speed, headway, etc.).
- WHAT: Under specified conditions (rain, accidents, etc.).
Driving behaviour factors in the studied infrastructure referring to speed, Critical Gap, or Follow-up Headway, are the most complex data to obtain in an empirical way. Not only because they are difficult to collect under different environments (e.g., rainy, peak hour) without interrupting in-site traffic, but also because it is very complex to process into raw data. As a result, such behavioural data are often overlooked or misused in traffic evaluation analysis as well as safety-related analysis.
Since many data collection technologies and devices have been introduced into the fieldwork, including radar-based devices, loop detectors, GPS-based devices, and video camera-based devices, such as UAVs: Unmanned Aerial Vehicles; data collection on driving behaviour has become more feasible and guarantees higher accuracy.
Among the above-mentioned devices, UAVs (commonly known as drones) are widely used to collect data on driving behaviour, due to its data quality at a reasonable cost. Also, they do not need additional ground equipment and, being non-invasive, do not influence the driver’s behaviour. They are capable of capturing the drivers’ tactical manoeuvring decisions in different traffic conditions, such as free/congested flow, normal/rainy conditions, commuting/non-commuting conditions, etc.
Because Vectio is so familiar with UAV data collection, we have a wealth of experience in processing videos that often contain certain flaws, such as poor lighting, instability, or rainy conditions. There are several programs that allow modellers to process the videos recorded by UAVs. They can obtain information not only about the traffic count for each movement and each type of vehicle, but also about the related driving behaviour, such as speed, headway, acceleration, lane change, and gap acceptance.
One that we have recently explored is the GoodVision software, that provides traffic modellers with an interactive platform to obtain the above-mentioned behavioural parameters through a video processing approach.
“The unique, cut-edge and interactive software platform developed by Goodvision greatly aids traffic and transport planners in analyzing traffic participators´ behaviours and satisfy our clients with great accuracy”.
Yang Wang, Principal Engineer at Vectio Traffic & Transport Planning
If interested in learning more about GoodVision’s services, check out our website and GoodVision’s blog!
Critical gap analysis
This article exhibits an example of how we obtain a critical gap using the data collected by the UAVs. The critical gap is an important parameter used to calculate the capacity and delay of minor roads in the Gap-Acceptance Theory of Unsignalized Intersections.
It is defined as the minimum time (headway) between successive vehicles in the opposing (major) traffic stream that is acceptable for entry by opposed (minor) stream vehicles (SIDRA User Guide). The accuracy of the capacity estimate is mainly determined by the accuracy of the critical gap.

The following 4-step method is proposed to estimate the critical gap of a roundabout, so that the accepted and maximum rejected gaps required can be obtained first, and then the critical gap can be calculated using the MLE (maximum likelihood estimation) technique. The procedure for processing the two indicators has the following 4 steps:
1. Preliminary observation of the traffic density
Preliminary observation of the traffic density and collection of approaching/circulating speed data of each arm of the roundabout in order to filter the traffic movements with successive streams (Image 1 and 2). It needs to be noticed that both, the accepted gap and the maximum rejected gap, can be obtained while moving with a successful traffic flow. The analyst must establish the threshold as a minimum follow-up headway to detect successful traffic flow. This threshold varies according to the type of traffic infrastructure.

2. Define the Gap event
Through the platform, the analysts can configure the stopping zone to obtain the gaps of the minor stream vehicles and the circulation line to obtain the gaps of the major traffic stream (Image 3).

3. Develop a proprietary method
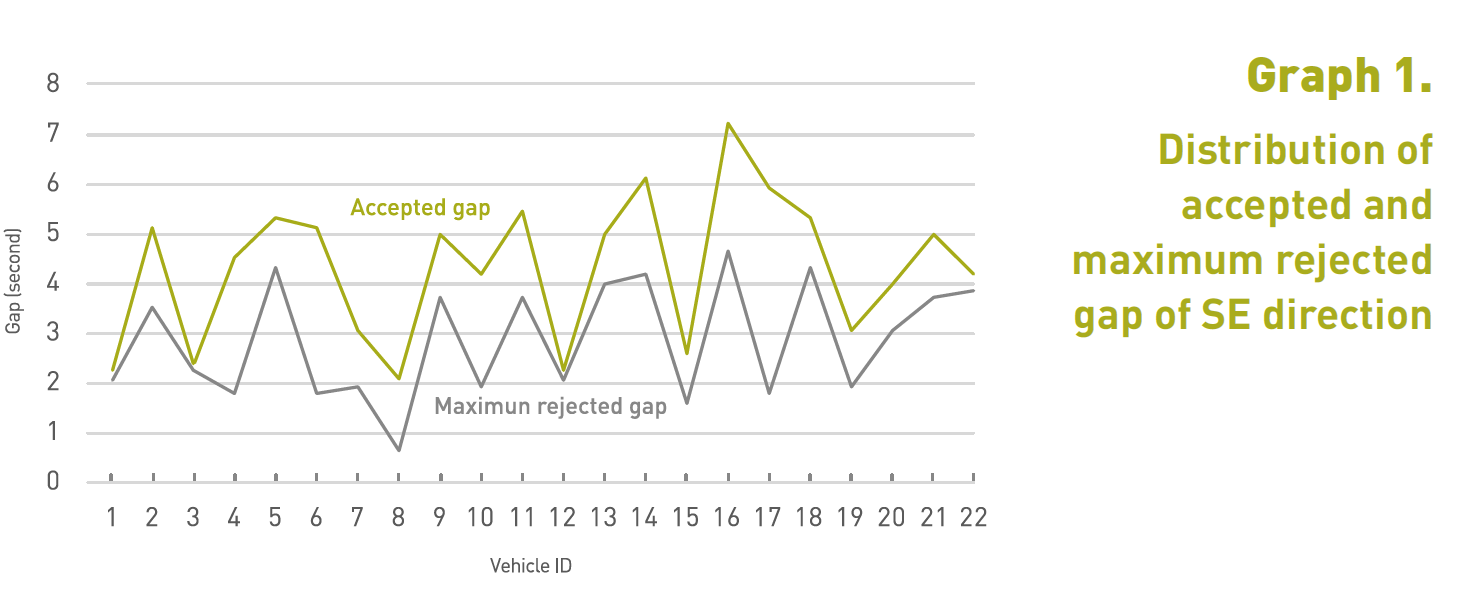
To obtain the flow of vehicles circulating in the roundabout (O/D matrix), and the time (headway) in which each of the vehicles enters or has to wait at the entrance. Thus, it is possible to calculate the accepted gaps and the maximum rejected gaps (Graph 1).
4. Calculate the critical gap
Calculate the critical gap for each lane and traffic movement using the maximum likelihood method.
Results
The maximum likelihood method (MLE) is applied to estimate the critical gap, which is based on the fact that a driver’s critical gap is between the range of his maximum rejected gap and his accepted gap. A probabilistic distribution for the critical gaps must be assumed.
If interested, you can find further information in Tian et al., (1999) work.
In this way, the critical gap obtained can be used to calibrate and validate the microsimulation program, such as Aimsun or VISSIM, and thus cover the entire range of traffic in the same road configuration. Finally, all the data collected using GoodVision’s platform will be adopted to evaluate the operation of the traffic according to the Level of Service.
Besides this methodology, which uses drone videos and the GoodVision platform to extract driving behaviour parameters, there are also other recourses with data from publicly accessible trajectory datasets, such as the highD dataset (German), the NGSIM dataset (USA), and open data portals (Canada), which may significantly contribute to this period of prosperity of traffic flow studies.
Visit my.goodvisionlive.com and try GoodVision Video Insights on your traffic study!
Read more success stories of our clients:
- Automated traffic data collection with CzechConsult
- Drone analytics with Ramboll
- Transport planning in Warsaw with IDOM
- Mobility planning with A+S
- Traffic Surveys in the UK with A-T-R
- Real-Time Traffic Monitoring for Congestion Prevention
- Using tethered drones for traffic surveys in Singapore
. . .. . References
- Tian, Zongzhong, et al. “Implementing the maximum likelihood methodology to measure a driver’s critical gap.” Transportation Research Part A: Policy and Practice 33.3–4 (1999): 187–197.
- Akçelik, R., and Mark Besley. “Sidra-2 user guide.” (1984).
- Toledo, Tomer. “Driving behaviour: models and challenges.” Transport Reviews 27.1 (2007): 65–84.
- Salvo, Giuseppe, Luigi Caruso, and Alessandro Scordo. “Urban traffic analysis through an UAV. Procedia-Social and Behavioral Sciences 111 (2014): 1083–1091.