Ask a random person about what traffic surveyors do, and most likely, they’ll talk about counting vehicle and pedestrian volumes, and… that’s it! And it’s a shame so little is known about traffic surveyors’ responsibilities, which go way beyond simple traffic counts.
From safety assessments and impact studies to identifying traffic patterns and supporting planners and modellers in their tasks, traffic survey specialists play a critical role in traffic management. And modern traffic data technologies support them in all these activities, providing detailed information and analyses about detailed traffic data and patterns.
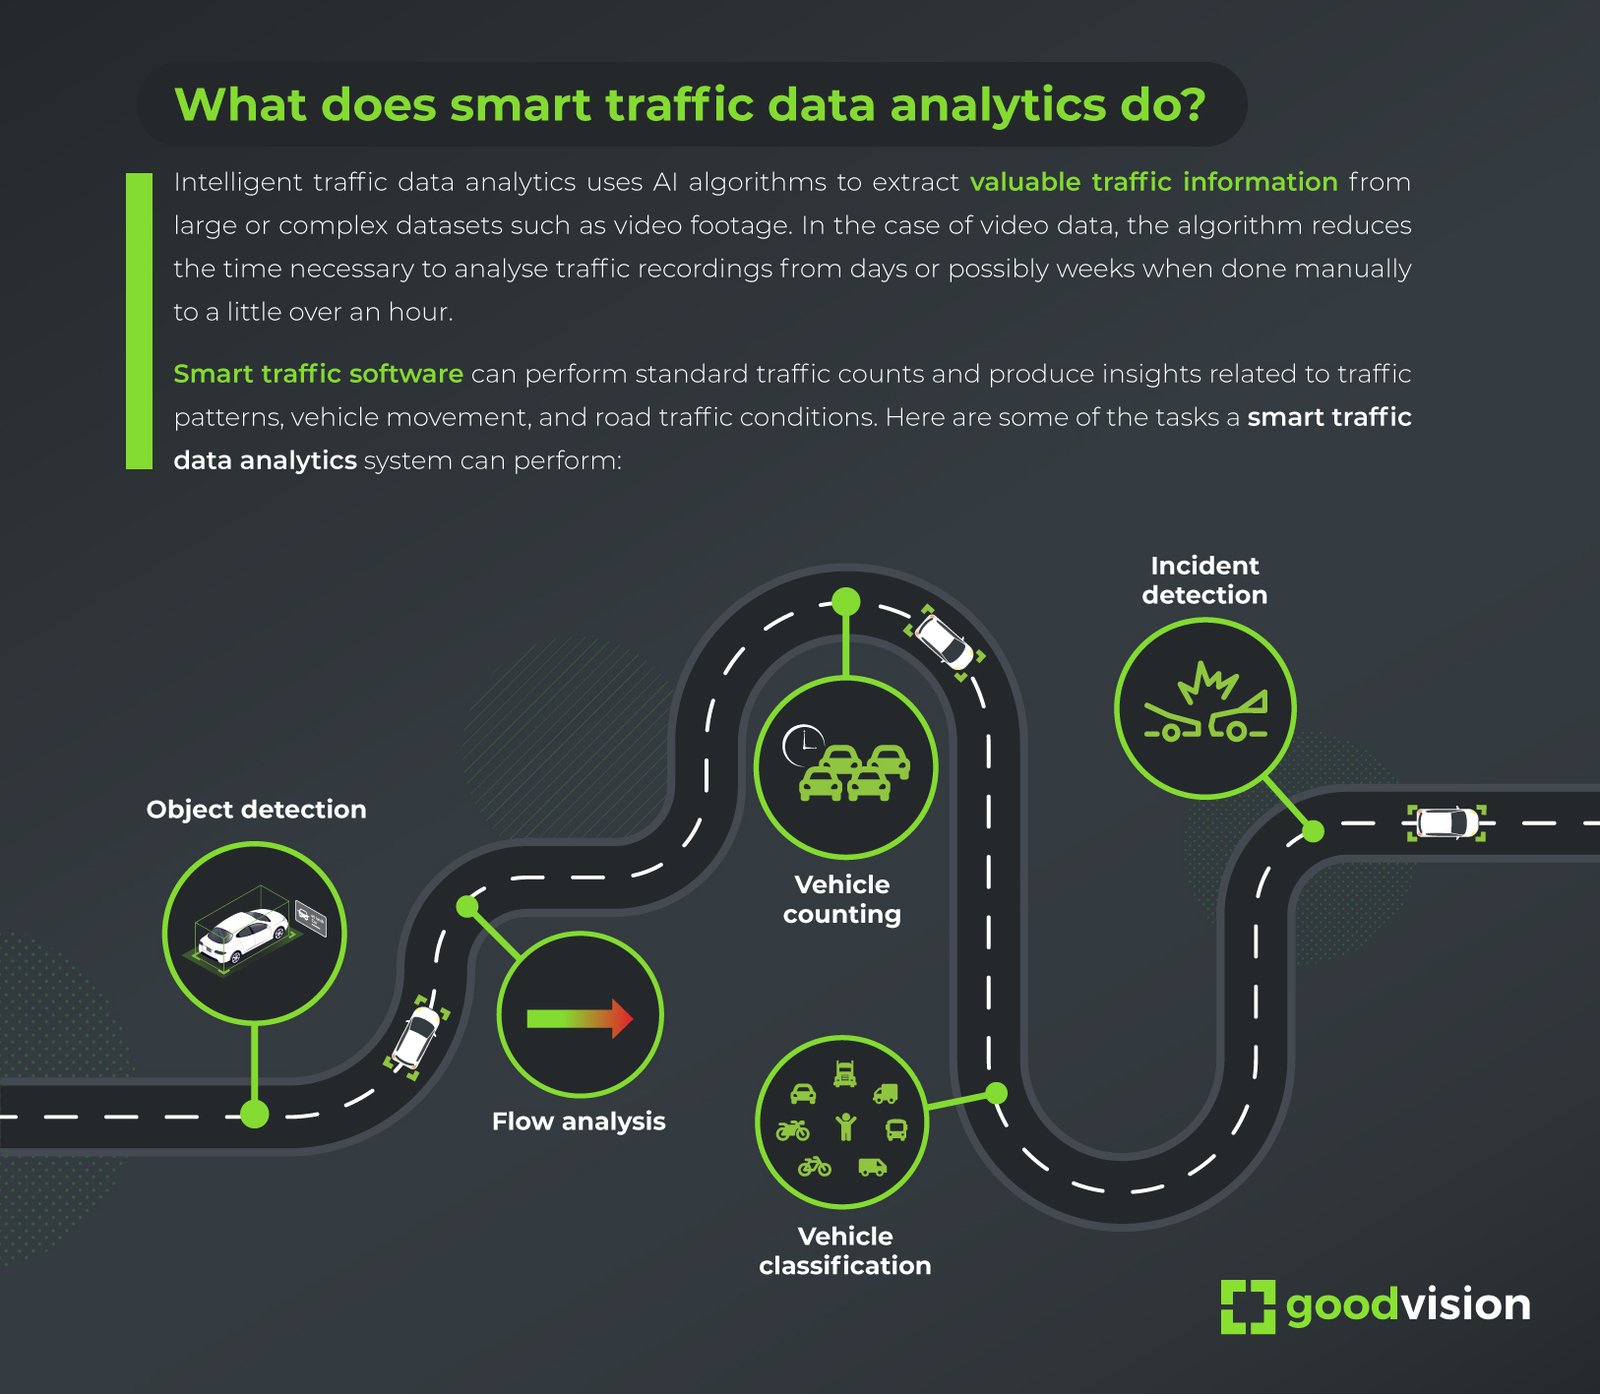
One such technology is smart traffic data analytics, which assists traffic surveyors in their daily work (and we don’t mean just traffic counts). How? Let’s see a few examples, along with real-life use cases.
Types of traffic counts analytical tools provide
Although traffic surveyors’ job is much more diverse than it’s commonly thought, performing traffic counts is still one of their primary duties. Here, smart traffic data analysis can be applied in several ways and paired with multiple technologies to address the specific road situation in the best way possible and provide the desired, reliable outcome.
Traffic counts
Traffic counts provide the data for analysis, enabling traffic engineers and managers to understand transportation networks and trends better. As such, traffic counts are an essential first step in making informed decisions about mobility, infrastructure, and taxation.
Smart traffic analytics platforms allow traffic surveyors to get more information from the raw datasets in less time. One of our clients was hired to conduct an annual traffic survey at the Cambridge Biomedical Campus. Its goal was to discover any changes in traffic flow and assess the impact and effectiveness of road interventions inside and outside the campus premises.
Using our platform and on-site cameras, they could perform a multi-modal traffic count for over 55 locations in a matter of hours and enrich it with visualisations such as heat maps and trajectories. Thanks to that, they provided their client with clear, actionable insights on traffic flow, trends, and vehicle distribution across the Campus.
Pedestrian and bicycle surveys
To tackle congestion, road safety, or greenhouse gas emissions by promoting non-motorised means of transportation, cities first need to assess the feasibility of the proposed policies.
In such cases, municipalities often rely on paper or email-based questionnaires to gauge attitudes towards such initiatives. By combining this traditional method with vehicle-specific traffic counts provided by smart analytics software, traffic surveyors can help decision-makers gain a different perspective and better assess the impact of said projects through data and visualisation.
One such initiative was the EU CiViTAS FLOW project. The program ran from 2015 to 2018 in multiple European cities to reduce congestion by encouraging decision-makers to create more opportunities for walking and cycling. A standout feature was an interactive Impact Assessment Tool allowing users to simulate and visualise possible scenarios for reducing motorised traffic. As a result, participating cities introduced a range of pedestrian and cyclist-oriented policies, including bike sharing, bike lanes, or cycle-to-work campaigns.
Drone traffic surveys
For traffic surveyors, drones offer a whole new angle on critical transportation spots. Drone footage is unobstructed and encompasses larger areas and road sections, giving a more accurate overview of the current road situation than most traffic camera recordings.
Intelligent traffic analytics software can be easily integrated with drone video recordings to perform top-view traffic surveys. Drone traffic surveys combine all the benefits of intelligent traffic data collection tools, such as automatic vehicle classification, digital twin capabilities, and fast, multi-modal traffic counts with a bird’s eye view. This allows for a clearer visualisation of road events and vehicle trajectories and facilitates further analysis.
Traffic drone survey offers a clear overview of the road situation
GoodVision worked with traffic data collection companies in various locations to conduct drone traffic surveys. In Singapore, for instance, we assisted our client in processing drone footage and handling its initial analysis. Our platform automatically stabilised the recording, removed any camera movement, and combined fragmented footage into a single video. Then, GoodVision Video Insights was used to select individual lanes for analysis and to quickly extract parameters like traffic counts, vehicle speed, and vehicle gaps.
Beyond volume - strategic view into traffic dynamics
What about measuring traffic parameters other than attendant types and volumes? As mentioned, smart traffic data analytics can capture more detailed insights. Here are some of the most useful ones.
Origin-destination analysis
Origin-destination (OD) records describe the number of trips made between two defined locations. In addition to geographic parameters, OD datasets often include other attributes such as timestamps, the number of trips between the two locations, or even the mode of transport.
OD analysis can be applied on a macro (district and cities) and a micro scale (junctions, roundabouts, and other road sections). Traffic data analytics software allows users to customise OD reports with self-defined entry and exit points and filter them by timestamp or vehicle type.
Turning movement counts
The more complex the intersection, the more challenging the turning movement count. That’s why manual methods may require several on-site observers for sophisticated, high-throughput junctions with multiple lanes and pedestrian crossings.
Instead, by using road traffic analytics platforms, traffic surveyors can use video footage from the required period to get exactly the records their clients require. Records for specific lanes, traffic participants, or manoeuvres such as turns, u-turns, or straight movement in one or both directions are available instantly and with one click.
In GoodVision, users can define custom traffic movements for turning movement counts and OD analysis
Incident and event detection
Incidents and rare road events occur infrequently; therefore, deducing insights, finding patterns, or identifying their causes can be challenging due to insufficient data.
Thankfully, video-based traffic data services make capturing and processing traffic data easier, including incident records. AI algorithms can be trained to detect non-standard road behaviour such as jaywalking or events like collisions in large volumes of video recordings and compile them for further investigation.
Parking occupancy
Parking space availability is a never-ending challenge for urban areas. Optimising parking spaces is necessary, especially in high-concentration zones like downtowns or commercial centres. For that, data is indispensable.
Traffic video analytics allow traffic surveyors to monitor parking spaces over a longer period. Cars entering and leaving the parking space are assigned numbers or identified based on anonymised licence plate data, making occupancy tracking largely automated. With that, traffic surveyors can provide their clients with insights on peak hours and correlations between increased demand and factors like cultural events or specific days of the week.
Pedestrian and footfall studies
Not all streets are made equal. Just ask urban planners or business owners looking for locations with the highest foot traffic possible.
To make that search easier, they may use location analytics to incorporate geographical context in business data to generate new insights. In this case, it can help determine an optimal business location based on footfall.
Here, automated traffic data analytics helps surveyors extract factors that can affect the commercial potential of an area, for example, peak hours for pedestrian traffic, footfall patterns, time spent in the location, and more.
.png?width=656&height=460&name=pasted%20image%200%20(9).png)
Tracking pedestrian traffic with visual trajectories
Location analytics is also invaluable for urban planning. By adding the visual, geographical context to pedestrian activity data, cities can manage footfall in hotspots such as tourist areas or shopping districts.
Better data, better traffic surveys
London, Singapore, New York, and dozens of other cities worldwide implement smart mobility networks. Traffic data analytics is at the heart of their ambitions, improving safety, sustainability, and comfort of living.
At GoodVision, we specialise in making that possible through video-based smart traffic data analytics. If you want to hear more about applying data technologies in your traffic surveys, message our team for a deep dive into GoodVision Video Insights.