.png)
Travel efficiency and traffic safety of non-signalized intersections are the main objectives considered in traffic management and control. Most intersections in cities are controlled by signal lights, no matter what level of traffic volume there is. Even if it may increase safety, it obviously decreases the efficiency of the throughput. On the other hand, there are intersections that have no control which leave the decision of safety and efficiency to drivers themselves. This may cause severe safety and congestion issues.
Introduction
Non-signalised intersections have more traffic conflict points than signalised ones. To improve traffic safety and decrease traffic delay, it is appropriate to take certain control measures, such as traffic signs or traffic signals. Stop sign and yield sign are the two most common traffic signs for non-signalised intersections for this purpose. When choosing the control measure, travel management with lower overall delay of traffic is selected as the optimal means.
Long story short, intersection is efficient if the vehicles from minor streams have a chance — a gap big enough to slip into the major stream without causing an incident or a unnecessary delay in both streams.
This article provides a quick step by step guide and a free-downloadable Excel tool to perform the gap acceptance analysis quickly and easily.
Vehicle gaps directly affect traffic delays
On non-signalized “T”, four-arm intersections or typical roundabouts, traffic flows operate as follows: the major stream has priority to cross the intersection without avoiding the minor stream. Whenever vehicles on the minor stream approach the intersection, they should at least slow down (yield sign) or stop (stop sign) and watch if acceptable gap exists in the major stream. What is the acceptable gap on your intersection? We’ll show you how to find out from the survey data.
Measuring vehicle delay is of great significance for evaluating the intersection service level. However, delay itself can be just a consequence of vehicle gaps on both major and minor streams. While small gaps on major streams cause bigger delays of traffic on minor streams, small gaps on minor streams cause even bigger queue length there. When combined, it drastically decreases the level of service and most often leads to the recommendation that intersection should be signal-controlled.
A step by step guide to gap-acceptance analysis in GoodVision Video Insights
Let’s go step by step with the analysis of traffic delay on the exemplary non-signalised roundabout. For the purposes of the tutorial, I am using GoodVision Video Insights traffic analytics platform (my.goodvisionlive.com). Traffic in the location below was captured using a fixed traffic camera and traffic data was collected from video footage using GoodVision Video Insights video analytics.
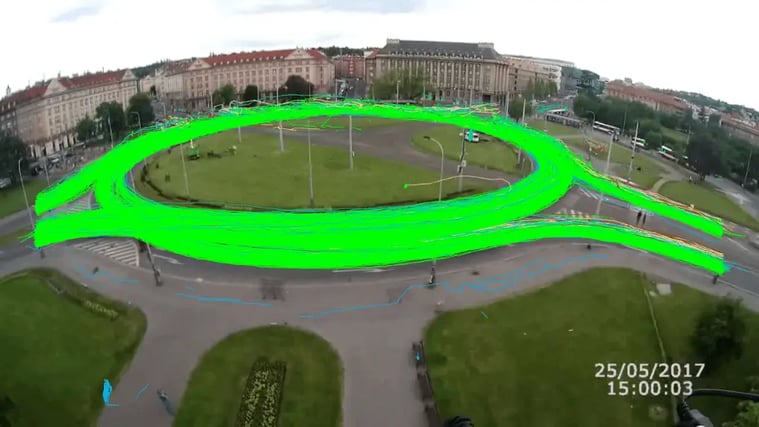
Screenshot of vehicle trajectories extracted from the video in GoodVision Video Insights platform
2. Defining the traffic movements for the analysis
In this guide, we will analyse critical gaps on WEST and SOUTH entries to the roundabout. These traffic movements will be considered as MINOR traffic streams, that give priority. The MAJOR stream is the main stream of vehicles with priority, inside the roundabout.Draw a virtual line to the place, where cars from minor stream are discharging into the roundabout. When they pass this point, it is considered that they merged with the MAJOR stream. Let’s label these line as WEST IN, SOUTH IN respectively.
Draw a second virtual line to the place, where cars are approaching the “waiting zone”. When they pass this point, it is considered that they are waiting for a gap to be accepted. Let’s label these lines as WEST WAITING, SOUTH WAITING respectively.
The recommended distance between these two lines is approximately of the length of the vehicle. Create traffic movements in GoodVision Video Insights for these two MINOR streams. Read about defining traffic movements in Video Insights. Label these two movements as MINOR WEST and MINOR SOUTH.
B) Creating MAJOR stream movements
Draw a virtual line to positions on the major traffic stream, where cars are passing by the minor stream entries into the roundabout. This will give us very precise time-stamps of cars passing by and not giving priority to minor stream cars. Let’s label these lines as MAJOR WEST, MAJOR SOUTH respectively.
Create traffic movements for each of these lines. Yes, the traffic movement in this case will be created only with one line per movement. Label these two movements as MAJOR WEST and MAJOR SOUTH.
See the desired configuration below:
.png?width=1628&name=1_5RxHX8Q2IEWpDmM_6hwC4Q%20(1).png) Screenshot of my workspace in GoodVision Video Insights with the setup for gap acceptance analysis
Screenshot of my workspace in GoodVision Video Insights with the setup for gap acceptance analysis
3. Getting the detailed lists of vehicle passages
To obtain the full list of vehicle passages on each of the movements, simply create a Vehicle List report and select these movements. Your report will be ready in a matter of seconds. Read about vehicle list reports on the GoodVision help portal.
See the example below:
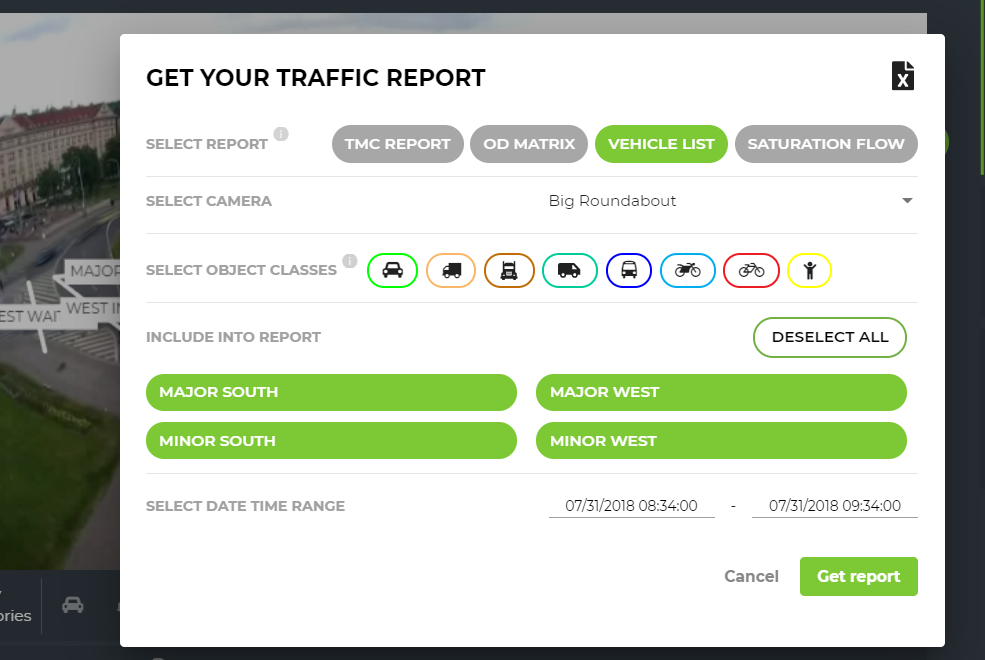
The window of the report builder in GoodVision Video Insights with selected “Vehicle List” report
Sample report is on the image below:
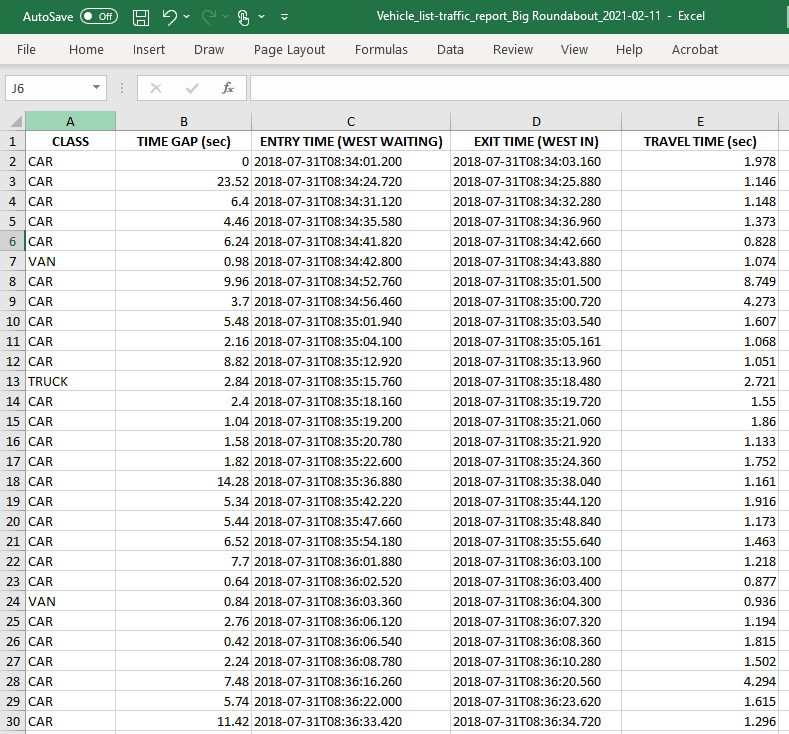
Sample of the Vehicle List report generated for the MINOR WEST movement
4. Gap-acceptance analysis
Gap acceptance analysis is fully automated in GoodVision Video Insights and the user is provided with the detailed report straight away.
Gap-acceptance analysis is always performed for each combination of MINOR and MAJOR movement. In our case, we will perform two separate gap-acceptance analysis reports:
- MINOR WEST versus MAJOR WEST
- MINOR SOUTH versus MAJOR SOUTH
How to do it step by step:
- Open the gap acceptance analysis reporting tool. You can download the free template from GoodVision HERE.
- In the file, there are two source sheets — MINOR STREAM and MAJOR STREAM, and one results sheet called GAP ANALYSIS.
- Now open the vehicle list report you generated previously. Copy and paste the required * columns (ENTRY TIME) from the MAJOR WEST sheet of the vehicle list report to corresponding columns of the MAJOR STREAM sheet in the Gap Acceptance Report.
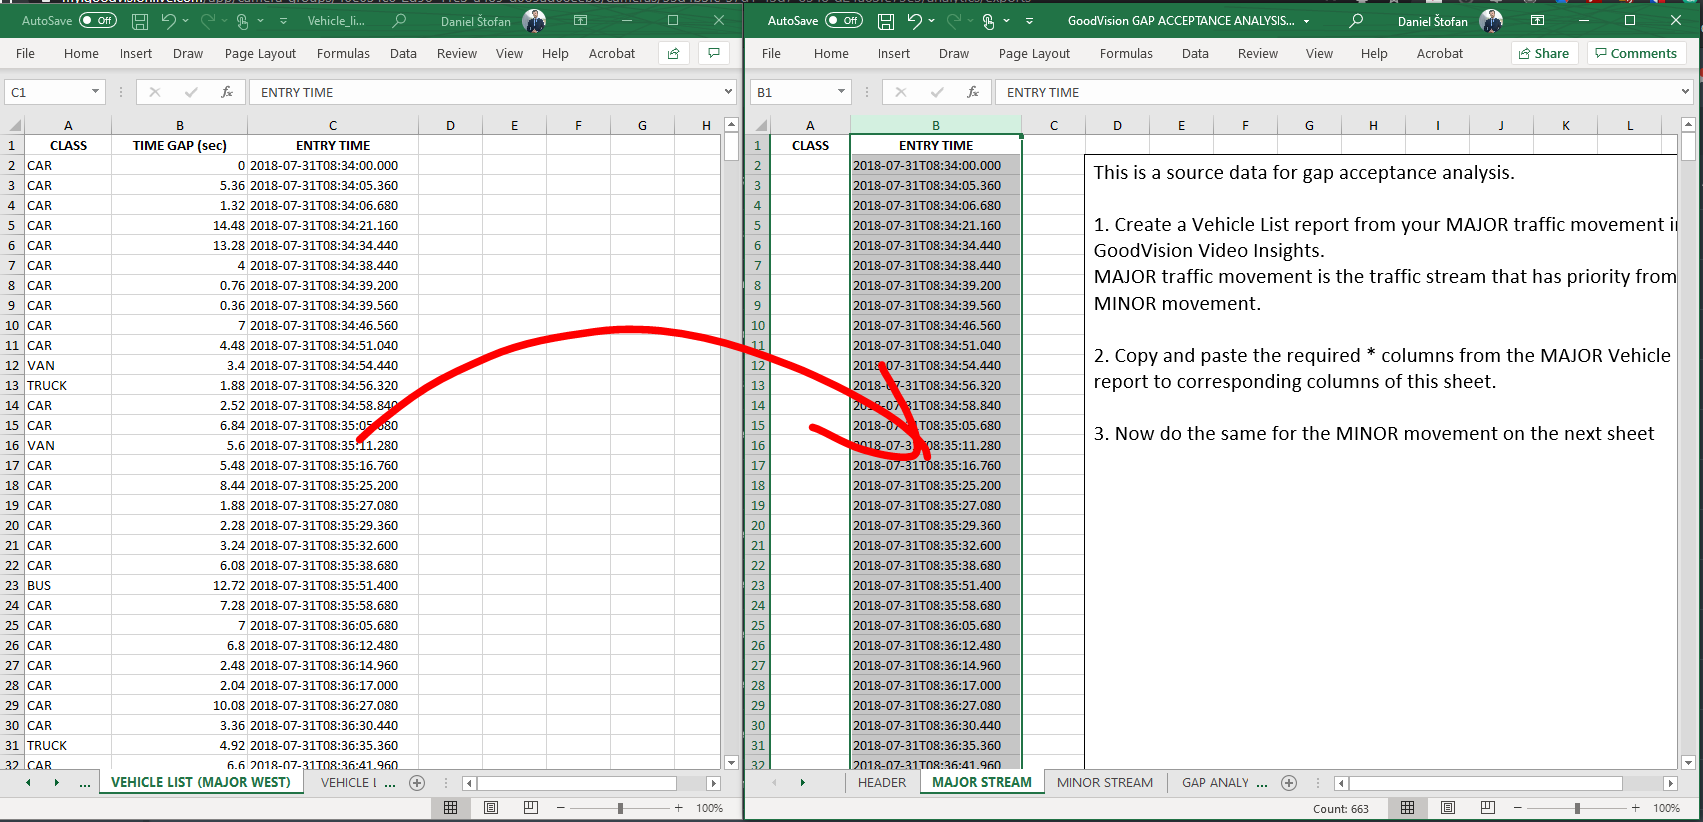
Firstly, copy the intrusion time data from the MAJOR stream vehicle list report
4. Now copy and paste the required * columns from the MINOR WEST sheet of the vehicle list report to the corresponding columns (ENTRY TIME and EXIT TIME) of the MINOR STREAM sheet in the Gap Acceptance Report.
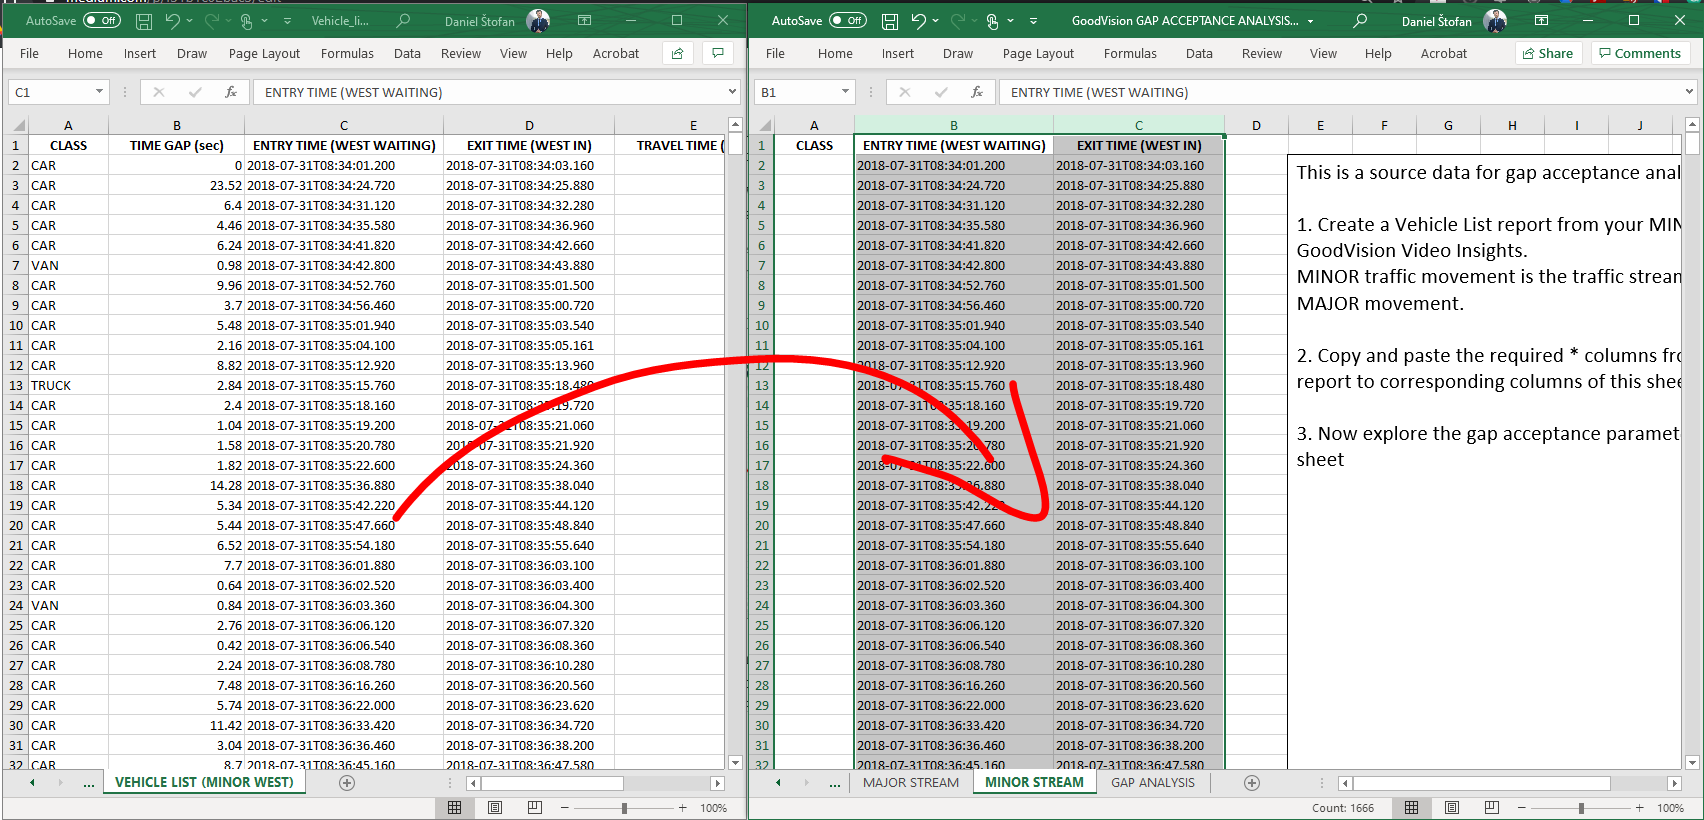
Secondly, copy the intrusion time data from the MINOR stream vehicle list report
5. All done. Now you can see the results of the gap acceptance analysis on the sheet called GAP ANALYSIS. Repeat for the SOUTH, or any other movement.
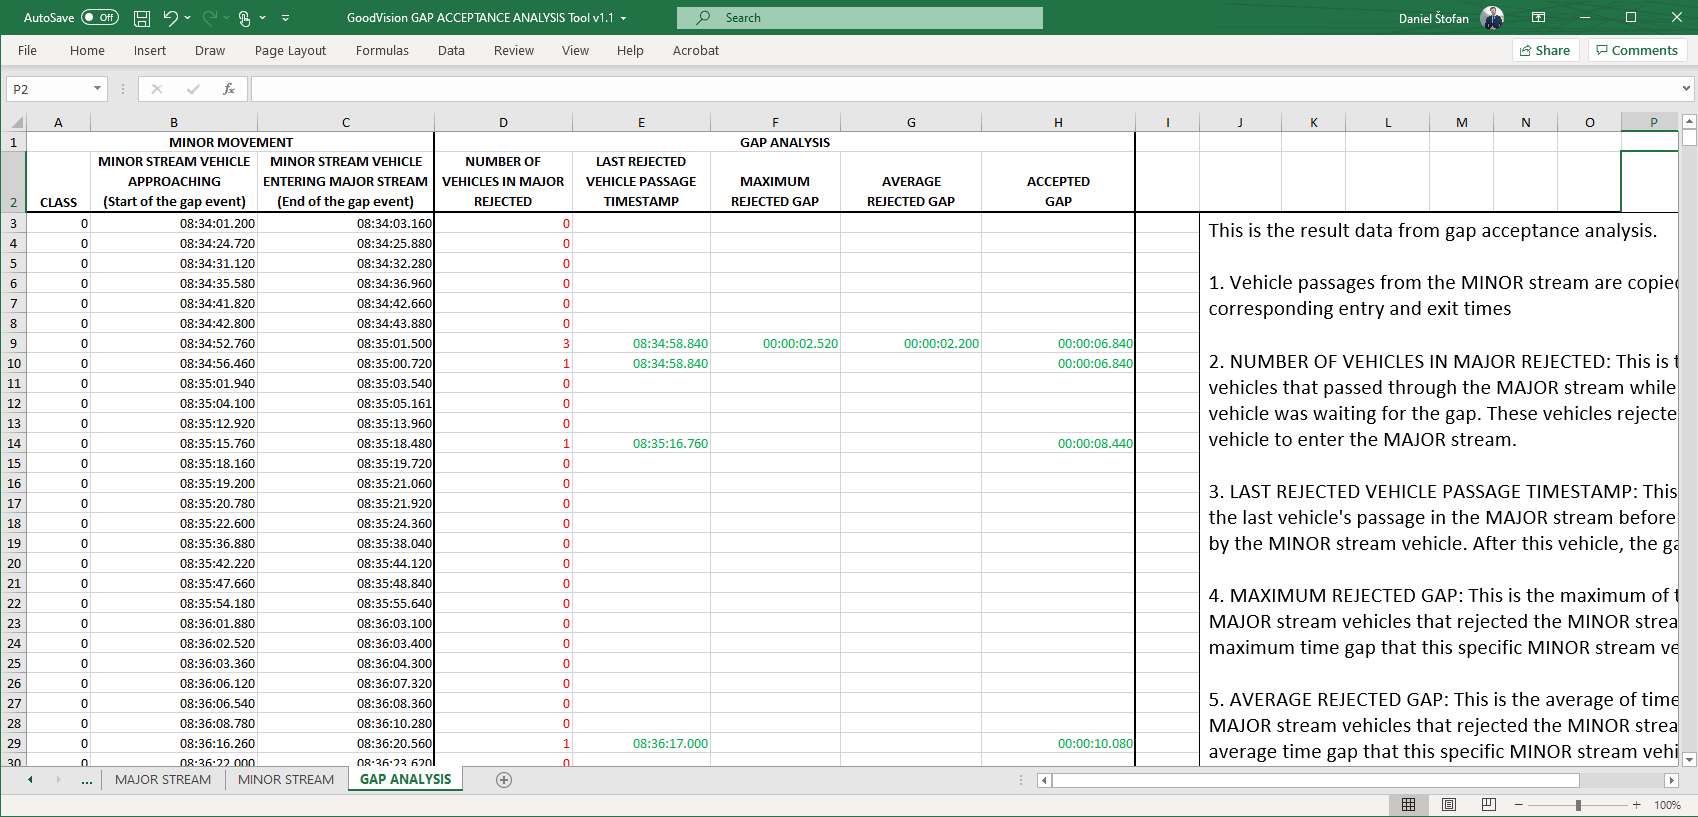
Gap Acceptance Analysis Tool calculates gap parameters automatically, soon will be a part of GoodVision Video Insights platform
Here is the explanation of the parameters it provides:
- NUMBER OF VEHICLES IN MAJOR REJECTED: This is the number of vehicles that passed through the MAJOR stream while the MINOR stream vehicle was waiting for the gap. These vehicles rejected the MINOR stream vehicle to enter the MAJOR stream.
- LAST REJECTED VEHICLE PASSAGE TIMESTAMP: This is the timestamp of the last vehicle’s passage in the MAJOR stream before the gap was accepted by the MINOR stream vehicle. After this vehicle, the gap was accepted.
- MAXIMUM REJECTED GAP: This is the maximum of time-gaps between MAJOR stream vehicles that rejected the MINOR stream vehicle. It is the maximum time gap that this specific MINOR stream vehicle didn’t accept.
- AVERAGE REJECTED GAP: This is the average of time-gaps between MAJOR stream vehicles that rejected the MINOR stream vehicle. It is the average time gap that this specific MINOR stream vehicle didn’t accept.
- ACCEPTED GAP: This is the time gap between the MAJOR stream vehicles that the MINOR stream vehicle finally accepted and entered the MAJOR stream.
- CRITICAL GAP: It is the minimum of the accepted gaps in the analysis.
I hope you enjoyed this guide. It can save you long hours of manual gap analysis on your traffic projects. Feel free to reach out to us for help at support@goodvisionlive.com
