Is it possible to make our roads completely accident-free?
Many doubt it. While road infrastructure and mobility technologies are becoming more advanced than ever and social awareness is rising, eliminating all road hazards seems far-fetched, as a brief look at the statistics suggests.
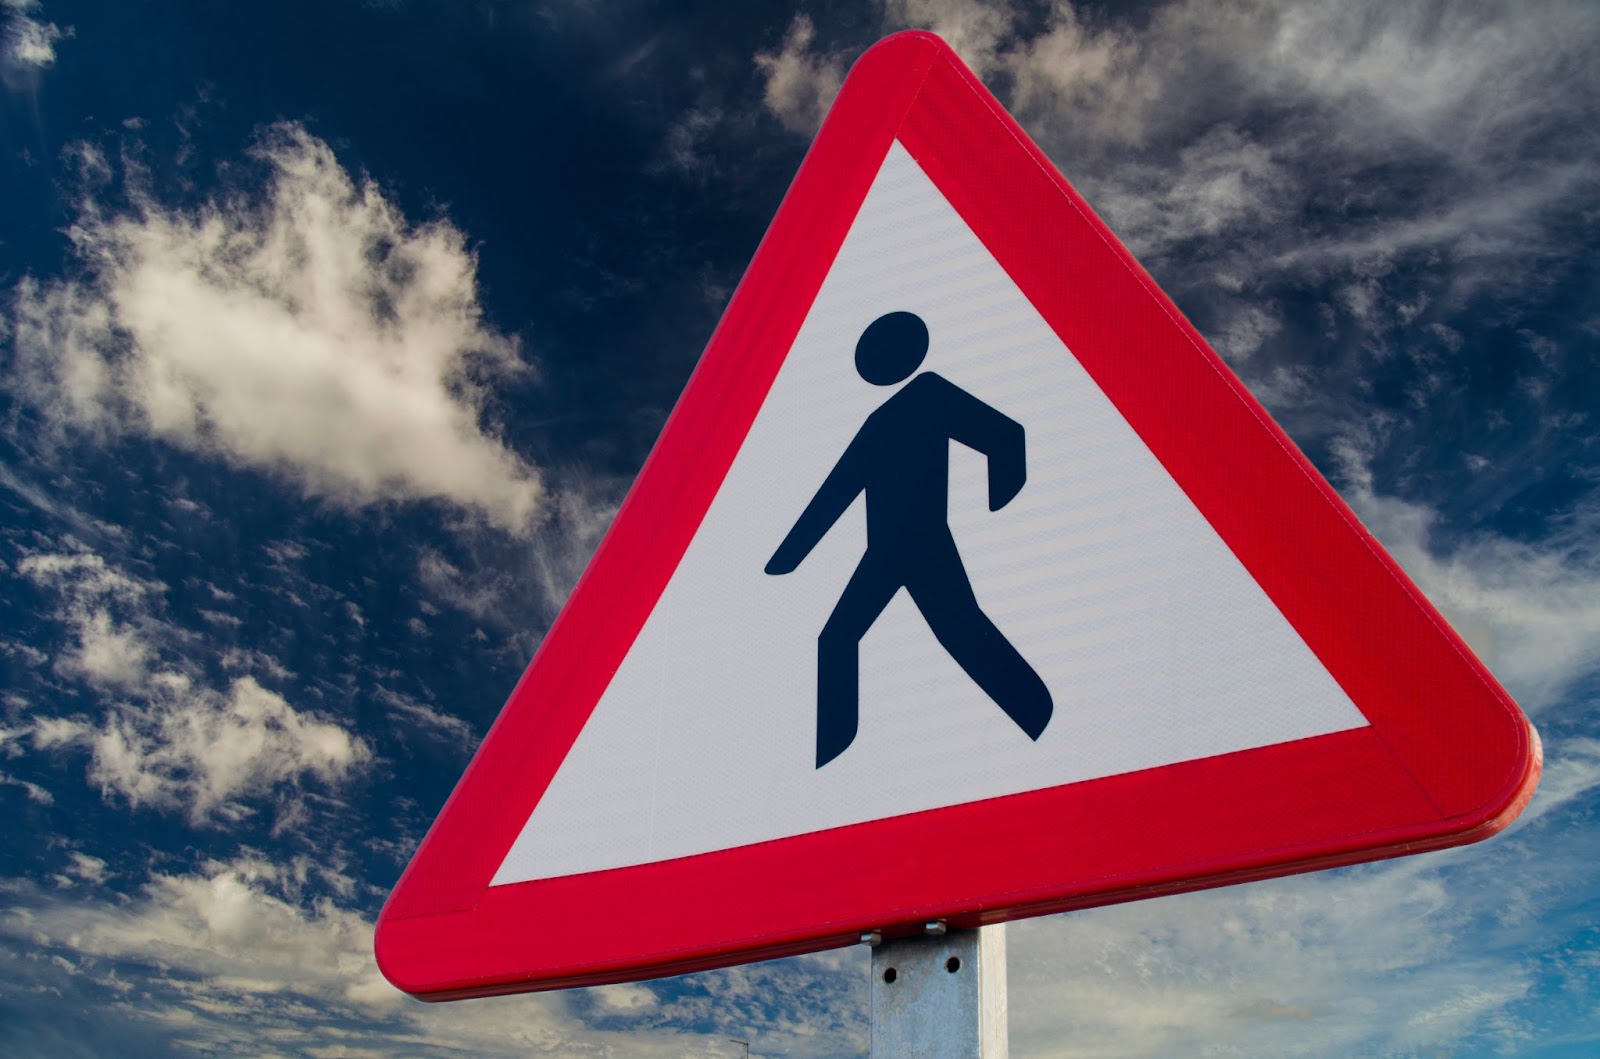
According to WHO, 1.35 million people die in traffic accidents every year. In the US, there were over 40 thousand traffic-related casualties in 2023 alone. The risk is particularly high for pedestrians, cyclists, and other vulnerable road users. This group represents 70% of all road casualties in EU urban areas. Back in the US, NHTSA estimates that in 2022, a pedestrian died in a traffic accident every 70 minutes.
But despite these numbers, preventing all traffic-related casualties is the core ambition of Vision Zero: a set of urban planning, design, and policymaking strategies aiming to make roads safe for everyone, for good. Since its inception, the concept has gained friction among an increasing number of planners, municipalities, and policymakers. Traffic data analytics is instrumental in its implementation.
What is Vision Zero?
Created in 1990 in Sweden, Vision Zero is built on the belief that every road incident can be prevented. To pursue and materialise that belief, Vision Zero cities should focus on two fundamental principles that distinguish it from other road safety approaches.
Designing road safety around human error
Traditional approaches to roadway safety assume that everyone can be trained or educated always to follow safety guidelines. Vision Zero recognises that eliminating all human errors isn’t possible and instead focuses on building the entire safety system around inevitable mistakes and human safety.
This way, even if human error leads to an incident, Vision Zero ensures that infrastructure, vehicles, and policies are developed to prioritise saving lives and minimise the risk of death or injury.
Shared streets, shared responsibility
In the Vision Zero approach, the driver is only one variable. Passengers, vehicles, road conditions, weather, infrastructure, and other factors may all contribute to an accident.
Then, it only makes sense to analyse each incident separately and search for multilateral solutions: educating road users, revisiting road design, and adjusting traffic policies. Vision Zero isn’t about blaming individuals; it’s about seeking systemic, multi-disciplinary solutions, proactively preventing crashes, and improving safety. We all share our roads; by the same token, we all should share responsibility for keeping them safe.
What type of data helps foster Vision Zero?
Even though its core assumption seems simple, Vision Zero is a challenging goal. In addition to funding, time, work, and advertising, it requires one more, perhaps most important thing: information.
The multidisciplinary approach that’s so fundamental to Vision Zero calls for the use of multiple types and sources of traffic data. Diversified, up-to-date traffic records give road safety specialists a broader and more accurate understanding of the situation, dangers, requirements, and other considerations needed to turn Vision Zero strategies into real-life solutions. What data is that?
Historical incident dataCompiling and analysing past crash data is essential for identifying dangerous road sections, incident causes, and future planning. At a granular level, such analysis can reveal highly specific hazards, such as particular turns or approaches. Traffic volume dataTraffic counts offer insight into the correlation between crash rates and traffic intensity and help transportation planners find road sections with the highest traffic volume where incidents occur more often. Traffic compositionRoad users like pedestrians or cyclists are at a greater risk than others. Traffic composition analysis can hint at areas that don’t see a lot of traffic but are still dangerous since they expose these vulnerable road users to collisions with motorised vehicles. Road users behaviourTraffic recordings provide one thing plain statistics cannot: a visual insight into the behaviour of all road users. Videos enable traffic engineers to observe each near-miss, risky turn approach, or jaywalking attempt directly and validate their hypotheses. Demographic dataRecords like age, ethnicity, medical conditions, housing status, and sex help traffic and urban planners understand how road safety impacts particular groups and communities. |
How does data analytics contribute to Vision Zero?
Traffic data is key to making our roads safer. It helps city planners and safety experts see where the problems are and how big they are, identifying danger zones and devising solutions. Urban stakeholders also use data to validate results and prioritise decisions. So, how exactly can they use data to make Vision Zero a reality?
Data-based accident prevention
One of Vision Zero's underlying tenets is a proactive approach to improving road safety. Here, data allows municipalities to identify patterns in traffic incidents, pinpoint high-risk areas and behaviours, and apply adequate countermeasures to prevent accidents before they occur. These measures may include adjusting signal timing, street design, or signage.
For instance, a Vision Zero project in Bellevue, Washington, showed that although motorised vehicles constituted 95% of incident participants, pedestrians and cyclists comprised 46% of casualties and serious injuries. The researchers also found that five behaviours contributed to 71% of all serious and fatal incidents in the community.
Based on the study, Bellevue authorities developed a range of safety strategies, e.g., implementing an automated speed enforcement system, reassessing speed limits citywide, or improving pedestrian signage.
With the use of AI-based video analytics tools, camera footage can also be used as a source of crucial safety data points, such as traffic counts, vehicle classification, gap acceptance, or near-miss statistics.
Understanding and modelling driver and pedestrian behaviour
Vision Zero cities acknowledge human limitations, but before planners can apply effective fixes, they first need to understand the behaviour of all road users. Data analytics can reveal behavioural patterns, such as jaywalking, running red lights, or failing to yield to pedestrians. Here, video analytics is particularly useful, providing visual validation for statistical data.
A pedestrian—and bicycle-oriented survey from Seattle delves into cyclist-driver interactions, distinguishing the most common crash scenarios. Each scenario was analysed separately to find the most serious and learn how they were related to behaviour and location.
Setting effective speed limits
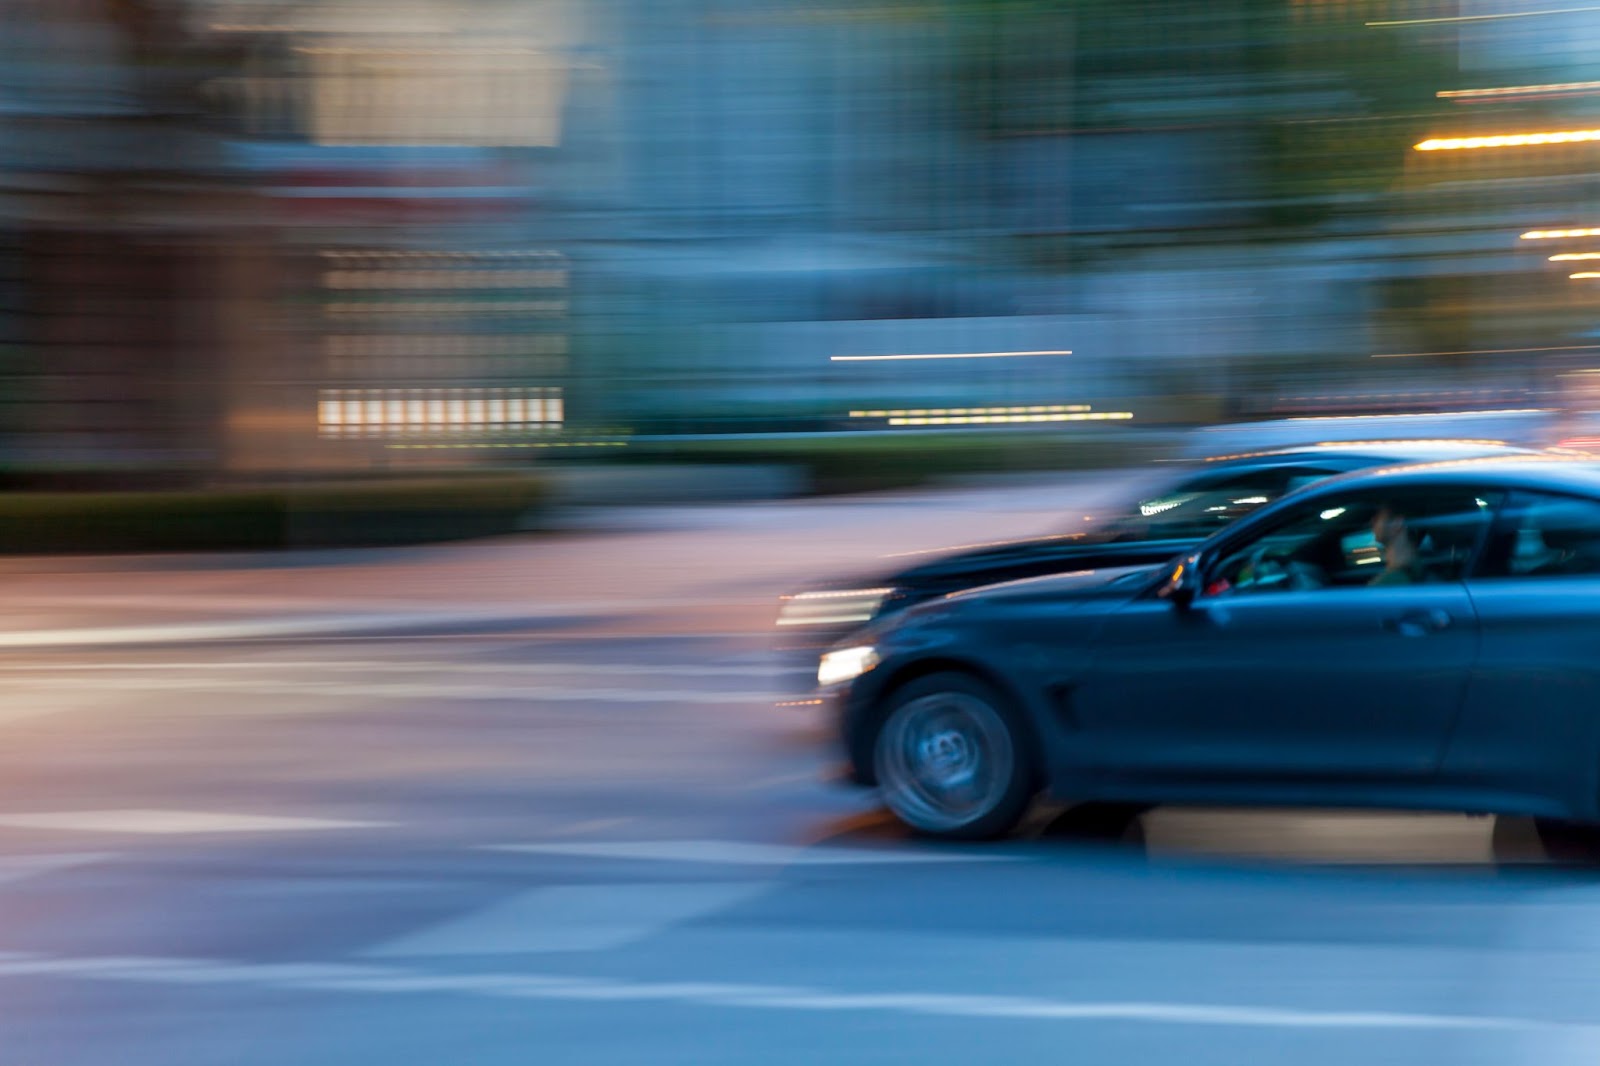
NHTSA reports that in 2022, speeding was a contributing factor in 29% of all road fatalities, making it one of the leading causes of dangerous incidents. Using speeding data analytics, municipalities can examine traffic data and locate areas where reduced speeds are necessary for safety. With that, cities can establish and modify speed limits, lowering the risk of accidents and enhancing street safety for everyone.
In San Francisco, speeding has been a major cause of deadly traffic incidents for years. Walk San Francisco, a local advocacy group, decided to investigate this issue. They looked at where speeding happens most and which spots have improved, thanks to past efforts. Their findings were published in a detailed report, suggesting fixes like setting the right speed limits, adding speed cameras, and installing speed humps.
Identifying high-risk areas
Finally, data analytics helps identify high-risk traffic areas by continuously monitoring traffic patterns and behaviours. To accomplish that, it uses various data sources, such as video footage and sensor data. Knowing these high-risk areas, municipalities can implement safety measures and anticipate incidents on other, similar road sections.
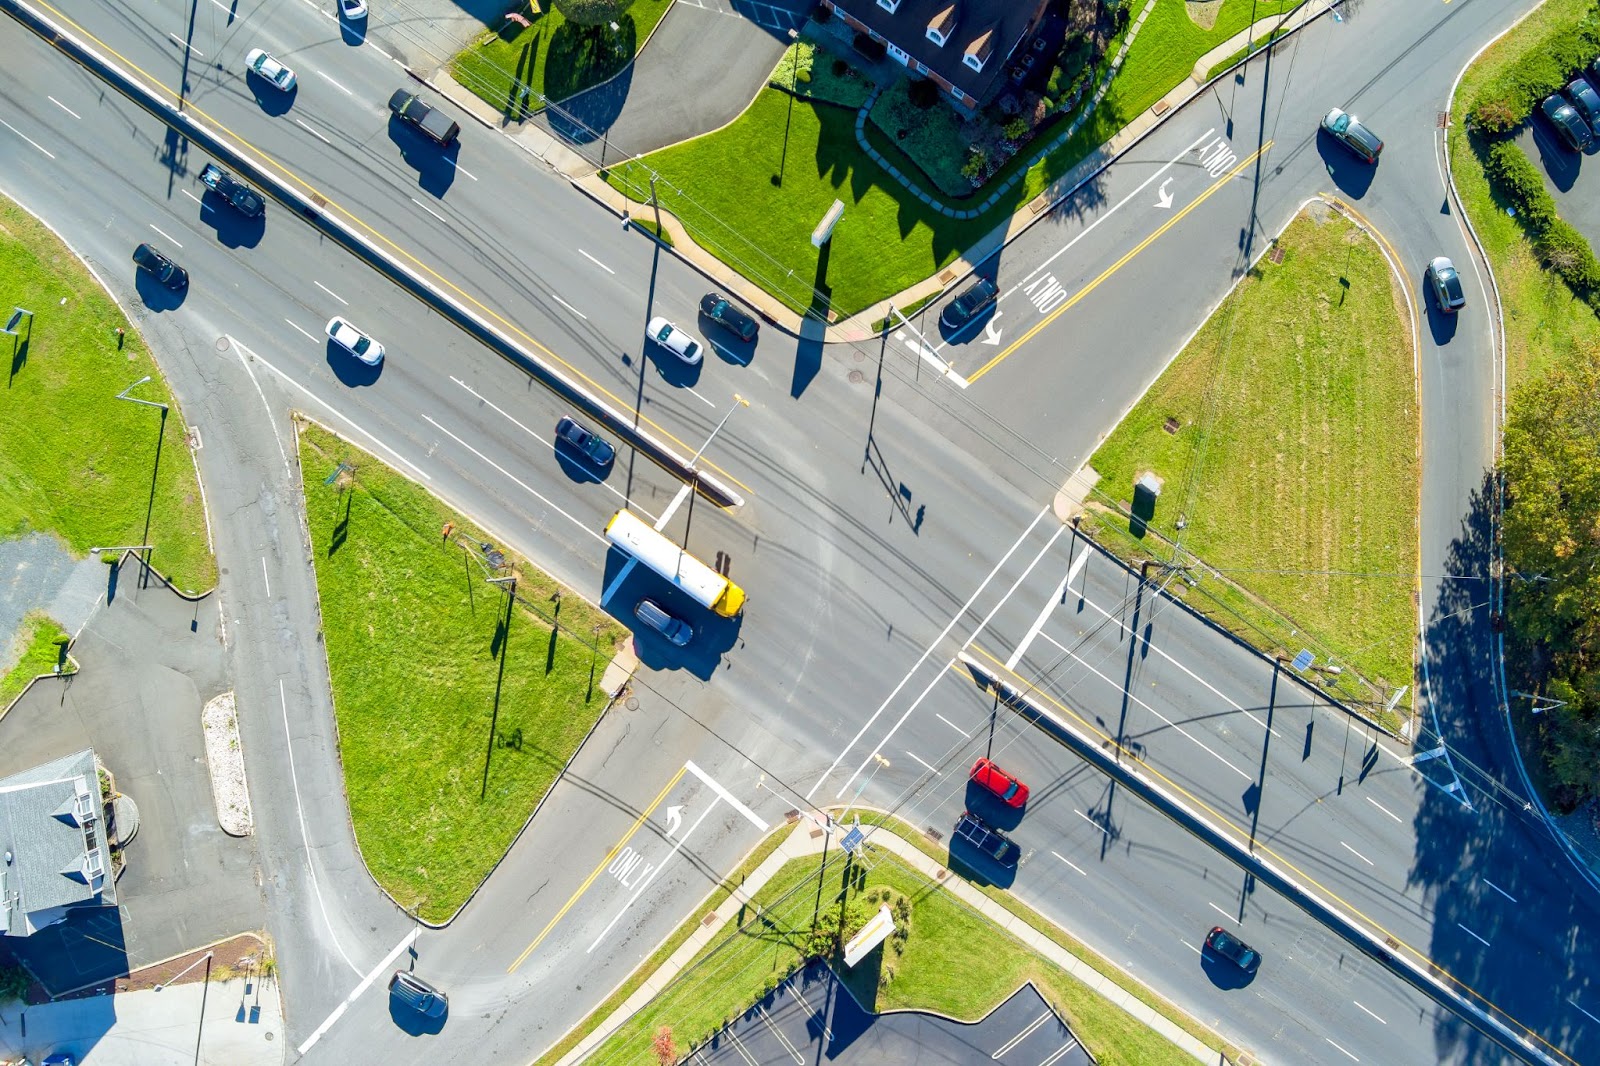
For example, a study by the New York City Department of Transportation focused on turns, showing that these manoeuvres have led to a disproportionate number of serious incidents. Its findings helped planners and policymakers improve over 900 dangerous intersections, reducing turn speeds by up to 59.8% and decreasing severe pedestrian injuries by 33%. For senior pedestrians, fatal and serious incidents dropped by 60%.
Making streets safer with (Good) Vision Zero
For over 30 years, Vision Zero has helped cities worldwide improve road safety through proactive strategies and systemic changes. Data analytics continues to enable these strategies and inform all Vision Zero efforts.
GoodVision fits well into all Vision Zero initiatives, not only as an accurate, scalable, and automated source of traffic data but also as an additional visual layer of data analytics. As a company that sits at the intersection of traffic, data, and safety, we’ll continue to explore these opportunities in future articles—stay tuned!
