.webp)
Traffic data types from GoodVision that any user can collect and analyze from his video. There are various types of traffic data and information about traffic behavior which can be collected in the streets or from the roadways. This data provides precious insights to traffic engineers on road usage, traffic patterns or safety. Traditional data collection methods like human surveyors or pressure hoses give very limited set of this data in contrast to video analytic solutions. This article provides the overview of the traffic data types that are collected and provided by GoodVision Video Insights.
1. Turning traffic counts and origin-destination counts
Analyze any traffic movement defined by custom-drawn entry and exit areas regardless of the type of the junction. You can count traffic on one gate or it is possible to chain multiple detection areas to define even very complex traffic movements and scenarios. Learn more about counting traffic on custom traffic movements.
2. Vehicles, bicycle, and pedestrian classification
Traffic data collection in GoodVision Video Insights includes 8 classes of traffic objects according to FHWA and UKCS scheme: Car, Van (LGV), Truck (OGV1 + OGV2), Bus, Motorcycle, Bicycle and Person. You are always getting this full set of classes no matter what is your project or report. Read about classification scheme in GoodVision Video Insights.
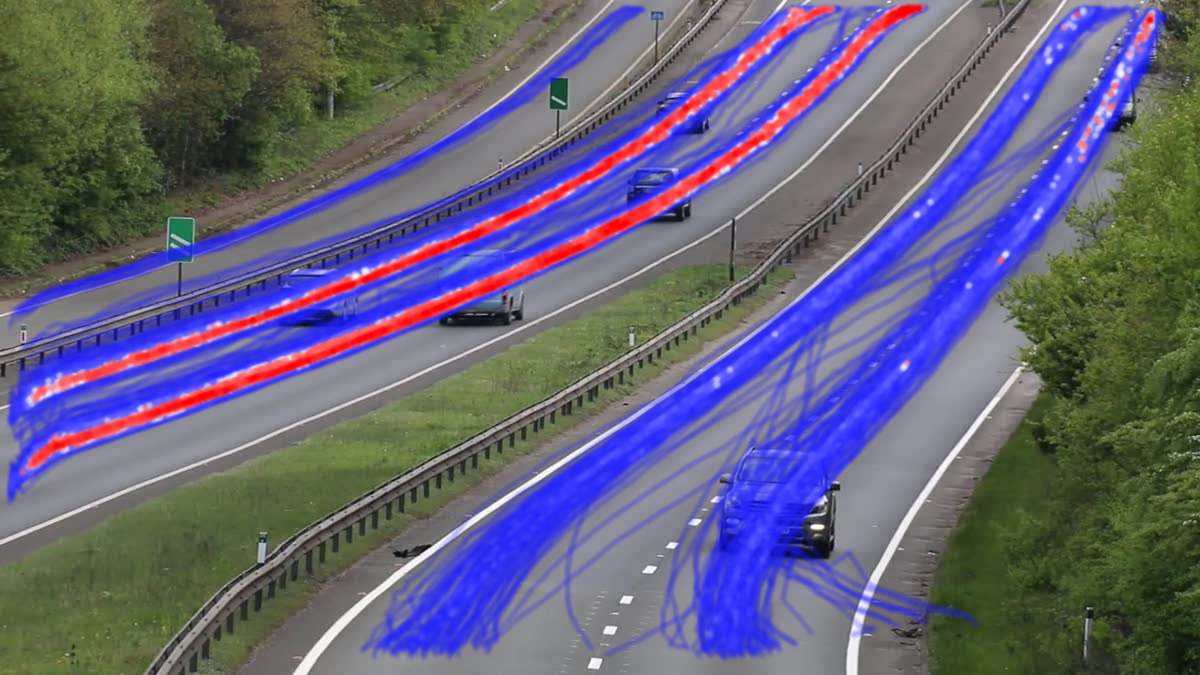
3. Exact vehicle trajectories
GoodVision provides full vehicle and pedestrian trajectories with exact positions in time with a millisecond granularity. This is amazing not only for visual analytics but also as the high-quality baseline for calculation of further metrics.
%20(1).webp?width=679&height=382&name=0_MjNJWXNFQ7b0DJFL%20(1)%20(1).webp)
4. Delay and occupancy time
Analyze delays and time spent in the area for various traffic movements separately or all at once. You can even filter traffic by time spent in the area. Very important when analyzing waiting times on lights or measuring the time spent on yielding on left turns.
%20(1).webp?width=679&height=382&name=0_1fWD-fyjb7wNLGcX%20(1)%20(1).webp)
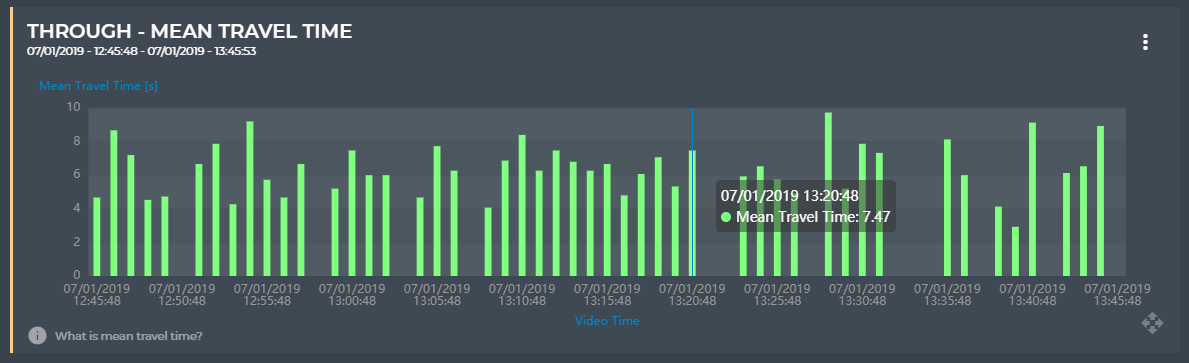
5. Travel time and speed estimation
GoodVision provides precise travel time information for each individual vehicle or pedestrian passing between various detection gates. Very valuable for exact speed estimation and analysis of the vehicle acceleration development inside of the junction. Since January 2020 GoodVision offers speed studies with exact speed estimation for every vehicle on straight movements. Contact us if you are interested in piloting the software.

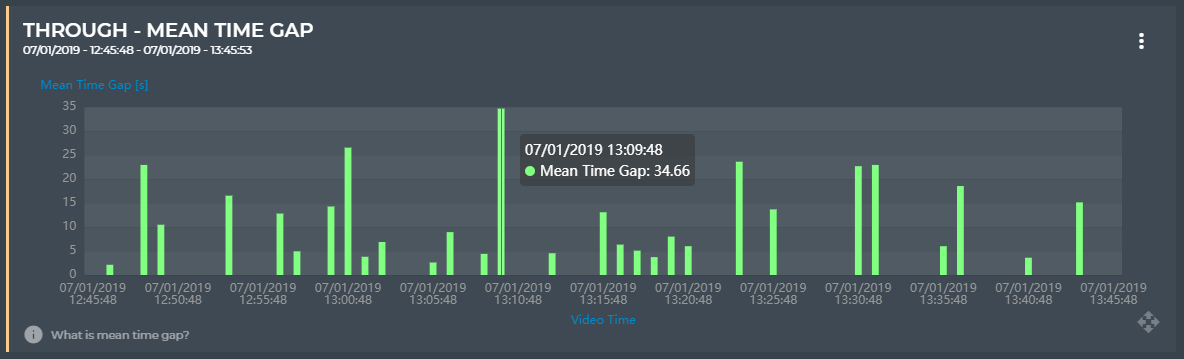
6. Time-gap (headway time)
Time gaps are very precious information to understand traffic flow behaviour, discover when the traffic is getting congested and many more. GoodVision provides time gaps for each individual vehicle on any of the custom traffic movements.
7. Jaywalkers and illegal maneuvers
Traffic analysts use GoodVision’s visual dashboard with exact traffic trajectories to identify jay-walking pedestrians or illegal movements like wrong-way passages, when performing traffic and pedestrian safety studies in school or mall areas.
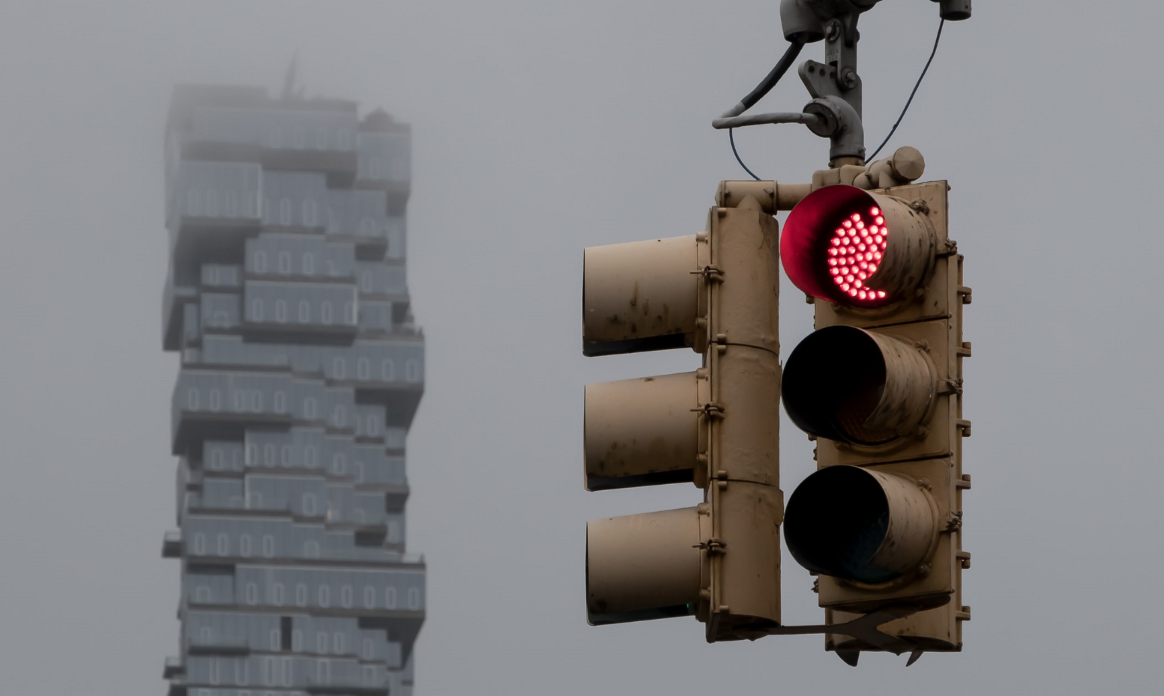
8. U-turns and red-light running
U-turn is just another custom traffic movement which you can easily define on your intersection and monitor it separately. Besides that, GoodVision reports the lists of individual vehicle passages through the movement with exact entry and exit timestamps, which allows to analyze it together with signal-timing intervals to identify e.g. illegal red-light runs.
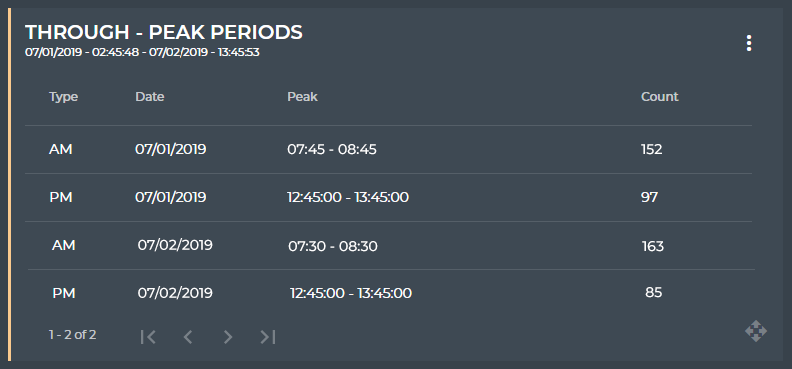
9. Peak traffic hours
Knowing the peak traffic counts and peak hours of heaviest traffic is a must. Video Insights reports these data for all your traffic movements or scenarios. You choose to find a single peak for the whole monitoring, or to report AM/PM peaks for each day.
10. Heat-maps of traffic volumes, acceleration and occupancy time
Video Insights visualizes the frequency of traffic movement on the scene. Hotter areas indicate higher traffic volume while cold areas indicate lower or no traffic. It is also possible to display heatmap of the traffic acceleration. Hotter areas indicate decelerating traffic while cold areas indicate accelerating traffic. This report is useful to indicate potentially unsafe areas or areas with huge traffic delays.