Saturation flow is a key measurement of on-street performance. It is an expression of the maximum capacity of a link as predominantly determined by junction characteristics like geometry, layout, turning radii, visibility, as well as vehicle composition. Saturation flows are usually required on each individual lane when modelling signalised intersections or roundabouts. Sat flows were always calculated manually. But today. for the first time, you can get rid of lengthy manual review and calculate it automatically in the matter of seconds with GoodVision.
How does GoodVision calculate saturation flows?
GoodVision Video Insights provides saturation flows calculation as a spreadsheet report for each traffic movement or lane. The algorithm is based on precise measurement of time-gaps between vehicles as they discharge into the intersection or a corridor. All needed measurements are extracted as vehicles discharge across the stop-line in free-flow conditions and thus unaffected by downstream interference such as congestion or exit-blocking.
GoodVision’s algorithm detects saturated free-flow conditions automatically within the desired time interval and uses these intervals for the calculation. As mentioned above, the computation of the saturation flow per hour is based on the time gap between vehicles, traffic volume and PCU parameters (passenger car units).
A step by step guide to a saturation flows report
Saturation flow report can be created in the report builder accessible on the Analyze screen in GoodVision Video Insights.
.png?width=679&height=427&name=1_GivjYRYxd_sBfmFz9Gw3fw%20(1).png)
- Click on “Get traffic report” in the top menu to open the report builder
- Select “Saturation Flow” in the traffic report builder
- Select object classes (vehicle types) which you want to include into the report
- You can adjust the PCU values for each vehicle class, by default, these values are set according to the United Kingdom guidelines
- Select traffic movements from your traffic scene — saturation flows will be calculated for each movement individually
- Select the time range for the report — you may select the peak hour, but feel free to select the whole survey duration as the algorithm is capable of finding all saturated free-flow readings automatically
- Potentially adjust the default algorithm values (see detail below) to match your country traffic guidelines and click “Get Report”
Saturation flows algorithm parameters you can adjust
The algorithm in GoodVision Video Insights is configured to meet TfL guidelines for the United Kingdom, but you can easily adjust the following parameters.
- END OF SATURATED FLOW — a condition when to stop the freeflow reading. If the time-gap between two consecutive vehicles is greater than this value, the reading will end. Default value is 4 seconds.
- MIN DURATION OF INTERVAL — the minimum accepted duration of the reading. Readings shorter than this duration will be ignored. Default value is 13 seconds.
- NUMBER OF IGNORED VEHICLES — number of vehicles on the start of every reading that should be ignored (e.g. on start of green, first two vehicles do not ideally represent the saturated flow). Default value is 2 vehicles.
- MIN NUMBER OF FREEFLOW READINGS — the minimum number of readings needed to calculate saturation flow for the traffic movement. If the algorithm cannot find this number of readings, the report will contain the intermediary result and a warning. Default value is minimum 10 readings
- PCU VALUES — the “passenger car unit” coefficients for each vehicle type. The default values from TfL guidelines for the United Kingdom are:
- CAR: 1 pcu
- VAN: 1 pcu
- TRUCK: 1.5 pcu
- HEAVY TRUCK: 2.3 pcu
- BUS: 2 pcu
- MOTORCYCLE: 0.4 pcu
- BICYCLE: 0.2 pcu

Created saturation flow report will appear on the Traffic Exports page of your camera in a few seconds or minutes.

The report
Saturation Flows report is an Excel file with multiple sheets. First sheet of the saturation flow report is the header with information about the camera, monitored interval and conditions for saturation flow calculation. Next sheets present the saturation flows for all selected movements.

Individual saturation flow Excel sheets are created for each traffic movement.

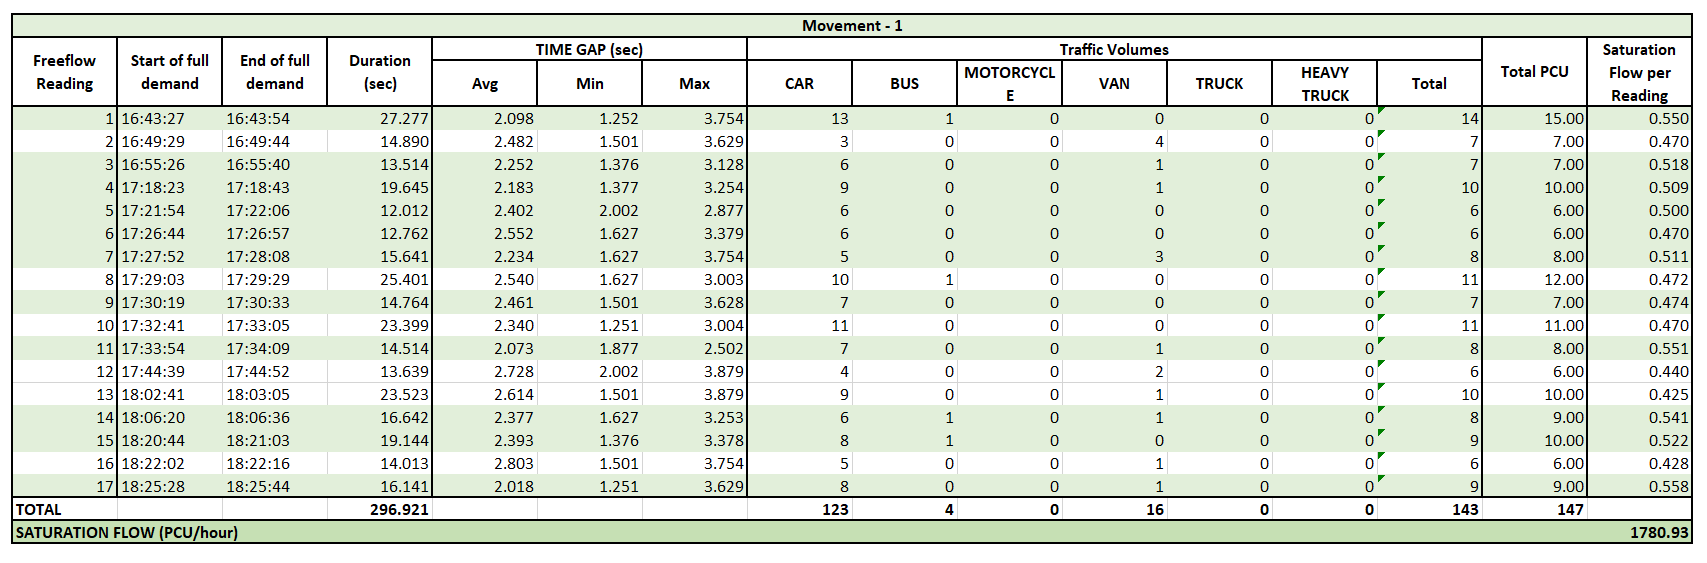
There are following parameters in the Saturation Flow report:
- Freeflow reading — each reading for saturation flow calculation
- Start of full demand — start of the reading for saturation flow calculation
- End of full demand — end of the reading for saturation flow calculation
- Duration — duration of the reading for saturation flow calculation
- Time gaps — minimum, maximum and average time gaps between the vehicles (in seconds)
- Traffic Volumes — multi-modal traffic volumes in each of the readings
- Total PCU — total passenger car units in each of the readings
- Saturation Flow per Reading — saturation flow calculated in each of the readings
- Total Saturation Flow — total saturation flow calculation for the selected lane
In addition to the sheet with TOP readings used for the calculation, the report contains the table with all freeflow readings identified by GoodVision algorithm. This is very helpful as any traffic analyst can transparently verify which readings were used for the final calculation. See the sample on the image below:
Conclusion
Just imagine, how much time and manual labor can this report save you. Try it yourself at my.goodvisionlive.com
