A Look to the Past, an Outlook for Future: Urban Mobility Trends that Will Shape 2024
As we all look with hope toward 2024, besides making ambitious resolutions, it’s worth looking behind to see what we can learn from the past as we plan for the future.
In urban mobility, the past couple of years have been marked by several trends best illustrated through statistical data:
- In 2022, the average yearly cost of driving in the UK increased by up to 37% (depending on the city and engine type).
- The total traffic volume in the UK has been up by over 10% compared to 2021 but is still below pre-pandemic levels.
- The average CO2 emissions of new passenger cars registered in Europe are about 6 g CO2/km lower than in 2021, largely due to the growing share of new electric cars.
The growing driving price tag, rebounding road congestion, shift toward EVs, and other urban mobility trends pose both a challenge and an opportunity for cities all around the world. In this data dive article, we’ll take a closer look at the recent prevalent developments that will affect traffic planning and management in 2024 and beyond.
Soaring cost of car ownership and driving
Even non-drivers have felt the fallout of the skyrocketing petrol price, be it inflation or growing prices of everyday goods. The surge is even more tangible for drivers. For instance, the UK fuel price hit a historical high in 2022 and has remained high ever since. But this is only one factor contributing to car ownership and driving costs.
First, the costs of owning a vehicle are continually increasing. On average, the manufacturer’s suggested retail price (MSRP) of a new car is up by 4.7% ($1,575) compared to 2022. At the same time, new vehicles are expected to depreciate 24% faster than last year, losing $4,538 in resale value yearly over a 5-year period.
Things aren’t much better when it comes to used cars. Those searching for vehicles up to three years old are now feeling the ripple effects of pandemic-era production disruptions and reduced supply that caused the price of used cars to skyrocket. In 2019, a $23,000 budget could get you an average three-year-old car (in the USA). Today, that’s not even enough to afford a six-year-old vehicle, which costs over $24,000 on average. The trend is the same for other countries, too.

Then, there are other costs of car ownership. Vehicle and fuel prices affected insurance costs, which soared up to 70% in extreme cases. The same is true for car repair and maintenance costs, which grow by 20% each year in the US and increased by one-third in the first quarter of 2023 alone in the UK. Add to that additional expenses like road tolls and parking fees, and you’ll see why car ownership costs have gone up to £3400 a year in the UK and… over $12,000 in the US.
What does it mean for urban mobility? As driving gets less affordable, more and more people may be inclined to switch to public transport or non-motorised modes of transport. Cities must keep track of their road situation and prepare for increased demand by optimising commute options.
At the same time, cities can help drivers alleviate the costs by improving parking space availability and tolling. Keeping road infrastructure in good shape will help reduce the accident rate and, effectively, car maintenance costs.
The impact of hybrid work on the commute
You’d think that millions of people working from home a couple of days a week would benefit overall urban mobility, right? Well, the answer depends on where you are.
In the D.C. area, for instance, road users and traffic analysts report that the commute times are now twice as long as before the pandemic. In some spots, travel time is slightly shorter than pre-COVID levels, but that only proves the main point: commuting patterns are now largely unpredictable.

Work schedules have become more flexible; commuters leave for work at different times and stay at home a couple of days a week—as a result, traffic volumes are much more erratic. Commutes also tend to be concentrated into a few days a week, while morning rushes get more intense and occur at varying hours. Even though some patterns can be observed—like Friday and Monday being the preferred home office days—hybrid work made long-term traffic predictions significantly more difficult.
On the positive side, some cities are seeing a noticeable drop in congestion thanks to the switch to hybrid work. In Brussels, for example, overall traffic congestion decreased by up to 26% between 2019 and 2022, although evening trips from the city actually take 10% longer.
All this goes to show that the situation may vary between cities and that municipalities shouldn’t make assumptions about the impact of hybrid work that isn’t rooted in facts and hard data. Swinging commuting routines affect congestion and the demand for public transport and parking spaces alike. Increased traffic puts an additional burden on emergency services. Here, live traffic analytics may be the answer, helping transportation managers react to dynamically changing situations timely.
Rising demand for EV infrastructure
It’s hardly news that EVs are on the rise. In the EU, the number of newly registered EVs skyrocketed in 2020 and has been steadily growing since, totalling 22% of all new vehicles in 2022. In the US, EVs are set to hit a record-high 9% share of all new passenger vehicles sold in 2023.
One of the fears holding drivers back from even faster EV adoption is range anxiety. A developed network of public chargers is necessary for enabling longer trips and giving drivers the certainty that they won’t be left in the lurch. While progress is being made in all countries with the largest EV markets, its pace isn’t equal—and in some, it can’t catch up with demand.
The EU recommends a ratio of 10 or fewer EVs for one public charger and an average of at least 1kW per EV. The Netherlands, a European leader in EV infrastructure development, has 5 EVs per charger and 2.6 kW per EV but only a 3% share of fast chargers. Many European countries are lagging behind, including France, Germany, and the UK, the largest EV markets on the continent, none of which meet the norm.
For comparison, China, the unquestioned global leader in charging infrastructure, boasts 7 EVs per charger, and 3.8 kW per EV ratios, and a 40% fast charger share. Although the US is catching up, McKinsey estimates that the country will still need about 28 million EV charging stations by 2030 to meet the demand for no-emission passenger cars.
![]()
No matter the growth rate, most countries encourage the transition by subsidising charger purchases, offering tax benefits for EV owners, or lowering charging prices. The role of the urban areas is to incentivise EV adoption on a local level.
This means researching optimal locations for charging stations and developing charging networks using their funds, and working with national governments and car manufacturers. Cities can also offer their own incentives, such as dedicated EV lanes, discounted and priority parking, tax reductions for companies, or exemptions from priced road charges. Data modelling methods like urban digital twins allow cities to simulate the interventions, assess costs, and see how they will affect their transportation networks.
Continuous congestion
Last but not least, the archenemy of urban mobility—congestion. Traffic jams continue to disrupt transportation in cities worldwide as urbanisation progresses. Yearly, road congestion costs each driver hundreds of dollars and dozens of hours they could spend more productively. The situation is the worst in capitals and major cities like London (156 hours lost each year), Chicago (155 hours), and Paris (138 hours). The consequences of congestion go beyond inconvenience and economic impact. Traffic jams negatively affect air quality and lead to higher road accident rates.
Most of the world experienced lockdown-induced drops in traffic volume but as the restrictions were loosened, road congestion started to rise again. Today, it exceeds pre-pandemic levels in 42% of European cities. In the UK and US, traffic volumes in urban areas are 72% and 39% higher than before COVID-19, respectively.
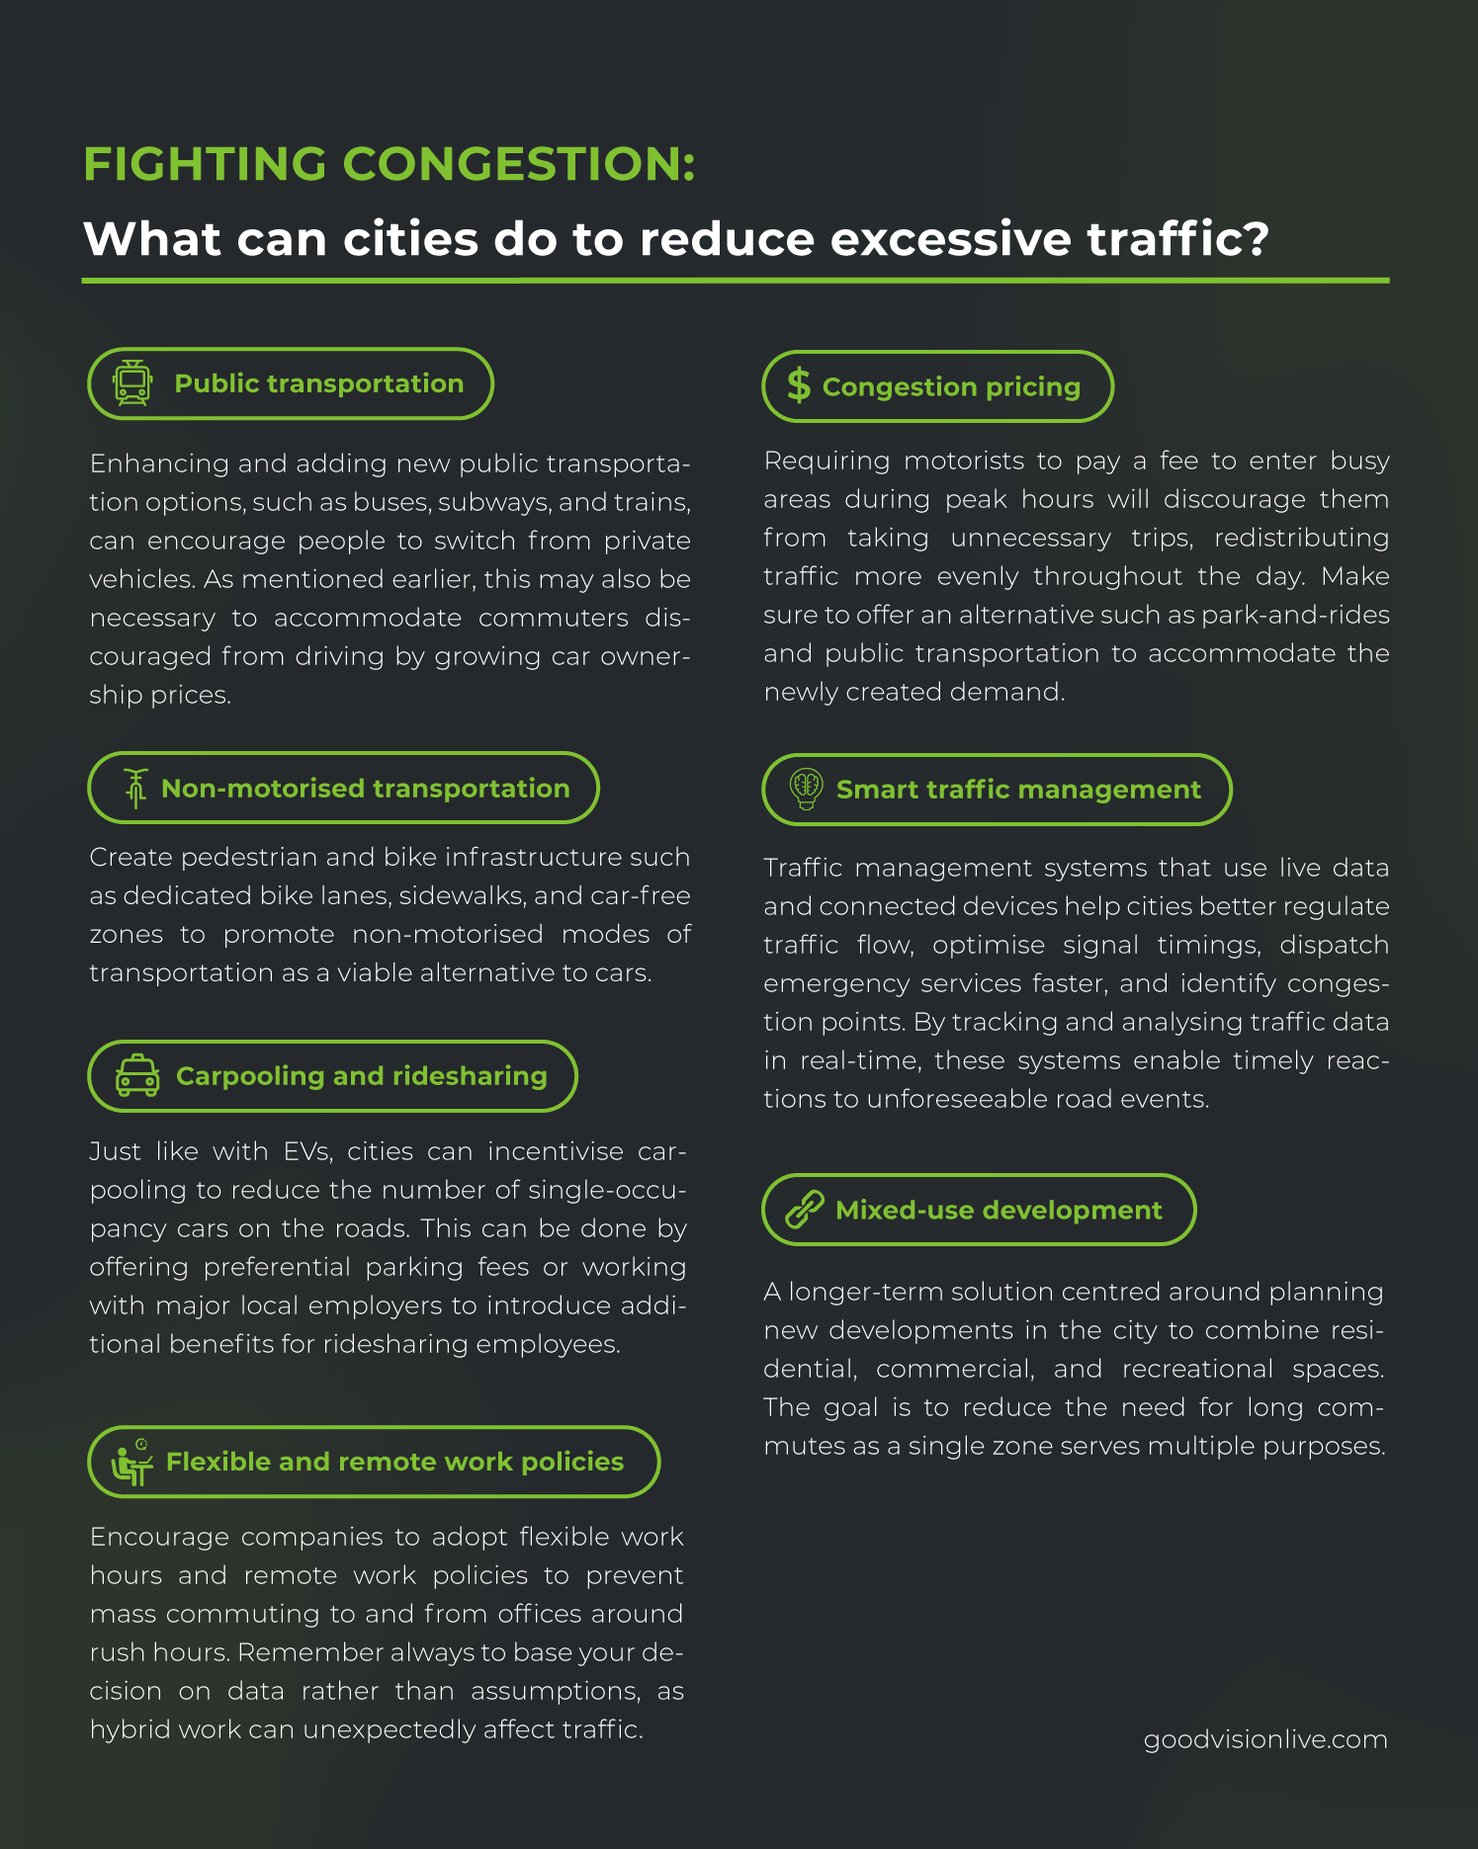
Since traffic jams aren’t going anywhere alone, cities must take measures to prevent excessive traffic. Luckily, there are many proven methods to combat congestion beyond the obvious answers, like expanding the current road network.

Outlook for the future of urban mobility
Whether adapting to the consequences of hybrid work or supporting the switch to new modes of transportation, modern technologies based on AI and data modelling allow cities to overcome past and future traffic challenges. And even if some of them, like road congestion, are unlikely to be solved completely, new solutions give traffic managers and city planners the tools to base their decisions on facts, not assumptions.
So, whatever your urban mobility-related resolution is, GoodVision’s traffic video analytics can help you make it stick by turning visual traffic data into answers. Give us a call, and let’s see what we can do for your city!


